Diagnosing a Slow Query and Its Execution Plan
You have seen this before. A slow query that powers a critical dashboard starts running slower than it should. You check the obvious suspects: the schema looks right, indexes are in place, and you just ran ANALYZE TABLE last week. Yet the query is still taking three times longer than it used to.
So you pull up the query plan. The optimizer has chosen to hash the large table and probe with the small one — exactly backwards from what you would expect. It is broadcasting a result set that should be a handful of rows but is actually millions. The intermediate data exploding through your cluster explains everything.
The optimizer is not broken. It is doing exactly what it was designed to do: pick the best plan it can based on what it knows. The problem is that what it knows — the statistics it collected — no longer reflects what is actually in your tables. The map it is navigating with is out of date. And when the map is wrong, even a perfect navigator ends up on the wrong road.
This is one of the most common and frustrating performance problems in analytical databases. It is not unique to SingleStore — every major DBMS deals with it. Statistics capture a snapshot of your data at collection time, but data keeps changing. Distributions shift, skew appears, tables grow unevenly. The optimizer keeps using the old snapshot until something forces a refresh, and in the gap between what statistics say and what your data actually looks like, query plans quietly degrade.
Traditional approaches — scheduled statistics collection, manual ANALYZE, sampling strategies — help, but they are reactive. You update stats after the problem appears, or on a schedule that may not match how fast your data changes. For complex queries joining many tables, a single stale estimate can cascade into a completely wrong plan.
Feedback Reoptimization (FR) is SingleStore's answer to automatic query optimization. Instead of relying solely on statistics collected before execution, FR watches what actually happens when a query runs — how many rows really flowed through each operator, how much memory was actually consumed — and uses that observed reality to generate a better plan. It corrects the map by watching where queries actually end up.
The rest of this post walks through how it works, what it looks like in practice, and what it delivers on real workloads.
A single cardinality misestimate can flip the entire join order.
Why Statistics Alone Aren't Enough
The optimizer is fundamentally a planner under uncertainty. It does not execute a query to decide how to execute it — it reasons from statistics: row counts, column histograms, distinct value estimates, null fractions. Given those numbers, it builds a cost model, scores candidate plans, and picks the one it believes will be cheapest.
This works well most of the time. SingleStore, like every major analytical database, invests heavily in statistics infrastructure: automatic collection, histogram construction, sampling strategies, and incremental updates. For well-behaved data and regularly maintained statistics, the optimizer makes good decisions.
But there are a few places where statistics consistently fall short:
Stale statistics after rapid data changes. When a large batch load, a nightly ETL, or a table swap happens between statistics collection cycles, the optimizer is navigating with last week's map. The actual row counts and distributions may have changed dramatically.
Cardinality means the optimizer's estimate of how many rows an operator will produce. When that estimate is wrong, every downstream cost decision gets shakier.
Join cardinality estimation. Even with perfect single-table statistics, estimating how many rows survive a multi-table join is hard. Correlation between columns across tables is not captured in standard statistics. The optimizer's independence assumption — that filter predicates on different tables are uncorrelated — breaks down on real-world data, and errors compound with each join added to the plan.
Highly skewed data. A histogram with a fixed number of buckets approximates distributions, but when data follows a power-law — a small number of values account for the vast majority of rows — even a well-maintained histogram may not capture the true shape accurately enough for join planning.
These are not edge cases. They are the normal operating conditions of most production analytical workloads.
What goes wrong when estimates are off
To make this concrete, consider a simplified version of a pattern that shows up repeatedly in real workloads. You have two tables:
1-- orders: 50 million rows, loaded fresh last night2-- customers: 200,000 rows, stable3
4SELECT c.region, COUNT(*) AS order_count5FROM orders o6JOIN customers c ON o.customer_id = c.id7WHERE o.order_date >= '2024-01-01'8GROUP BY c.region;
The optimizer looks at its statistics. customers was large when stats were last collected — say, 40 million rows — because it was measured before a major cleanup job deleted 98% of the rows. The histogram still reflects the old shape.
Based on those stale statistics, the optimizer decides to use customers as the probe side and hash orders — the opposite of the right call. It builds a 50-million-row hash table in memory, then scans it once. Memory pressure spikes. Execution slows.
What the optimizer needed to know was simple: customers is now tiny. If it knew that, it would flip the join: hash the small customers table, probe with orders. The query would be fast.
This is exactly the class of problem feedback fills. Not a schema issue, not a missing index — just a gap between what statistics say and what is actually in the table.
After FR profiles the first execution and sees that customers produced only 200,000 rows — not 40 million — it reoptimizes the execution plan using the actual row count. The next execution uses the correct join side. No hint required. No manual ANALYZE. No query rewrite.
That is the gap statistics leave open, and that is what feedback is designed to close.
How Feedback Reoptimization Works
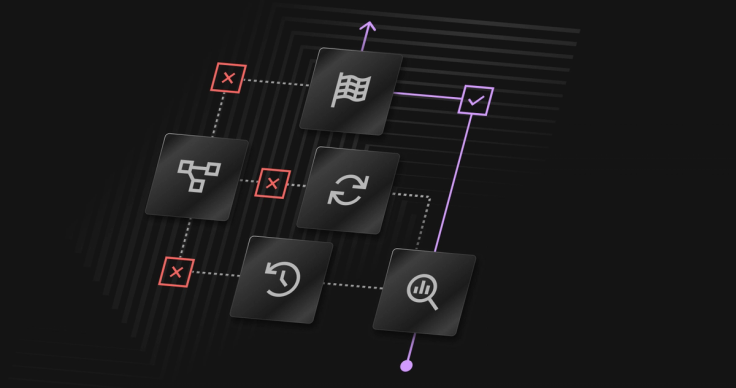
Feedback Reoptimization is a learning loop built around the query optimizer. It has four stages: observe, identify, replan, and validate. Every stage matters — and the last one, validation, is what makes it safe to run in production.
You can think of FR as a guarded retry loop: observe what happened, try a better plan, and keep it only if real execution proves it is better.
Observe: collect runtime statistics
When a query executes, SingleStore can profile the actual runtime behavior of each operator in the plan: how many rows it produced, how much CPU it consumed, how much memory it used. This is not free, so FR is selective — it focuses profiling on complex, expensive queries where the data is most likely to be useful. In 9.0+, auto_profile_type = SMART handles this automatically.
Identify: detect misestimated plans
Not every query that runs slowly is a candidate for FR. The system applies an admission check before investing in reoptimization:
- The query must be expensive enough to matter
- The gap between estimated and actual row counts must be significant
- The plan must not have already converged from a prior FR run
When a plan clears these filters, it is marked as a reoptimization candidate. This can happen automatically (the engine detects the mismatch) or manually (REOPTIMIZE MARK <plan_id>).
Replan: generate a better-informed candidate
Once a plan is marked, the next execution triggers a reoptimization run. The optimizer re-runs its search over the plan space, but this time it has runtime feedback from real execution as additional input alongside statistics. With corrected cardinality estimates, it may find a different join order, choose a different hash join side, or select a different distribution strategy.
Crucially, the FR run is isolated to the execution that triggered it: concurrent queries keep using the current validated plan without interruption. Only one FR run executes per plan at a time to prevent resource contention.
Validate: compare before committing
The candidate plan is not adopted immediately. SingleStore executes it and compares its measured performance against the original across three dimensions: CPU, network time and memory. The new plan is adopted only if it shows a clear improvement in at least one dimension without meaningfully worsening the others.
If the candidate is worse, it is discarded and the original plan remains in use. This compare-before-commit step is what separates FR from an optimizer that blindly replaces plans.
Built-In Safety — The Plan You Don't Adopt Matters Too
A reoptimization system that makes things worse is more dangerous than no reoptimization at all. FR's design takes this seriously.
Every candidate plan goes through a validation step before adoption: execute the candidate on the real workload, measure its runtime behavior, and compare it against the current plan. If the system determines that the candidate is not an improvement, it is discarded. The original plan stays live, and the next execution uses the known-good plan as if the candidate had never existed. In other words, FR is designed to avoid persistent regressions: a candidate that does not hold up in real execution is not kept.
Importantly, even when a candidate is rejected, the runtime observations collected during its execution — actual row counts, join cardinalities, resource consumption — are not thrown away. That data remains in FR's feedback store. It informs the next reoptimization attempt, and it is available for related queries that share the same join patterns. The plan is discarded, but the learning persists. Every FR run, whether it produces a better plan or not, leaves the system with more accurate knowledge about the workload.
Across the evaluated benchmarks, more than 97% of queries never experienced a persistent regression. For the small number that did regress temporarily, the system self-healed within subsequent iterations. FR is designed to be something you can leave running in production without babysitting it.
Results — What Happens When the Map Gets Fixed
We evaluated FR across two standard analytical benchmarks: TPC-H (24 queries, scale factor 100) and JOB — the Join Order Benchmark on IMDB data (113 queries). For each query, we ran five control executions and five FR executions and measured query time, CPU, network, and memory.
The headline numbers below measure elapsed-time change. A query counts as improved if it got at least 5% faster; the other columns show the average reduction among those improved queries and the largest single-query reduction.
Benchmark | Queries improved | Average reduction among improved queries | Largest single-query reduction | Data character |
JOB (IMDB) | 73% | -25% | -68% | Extreme skew, power-law |
TPC-H | 42% | -15% | -21% | Uniform, synthetic |
The pattern is clear: FR's impact tracks data skew. The messier and more skewed your real-world data, the more FR has to work with. JOB's IMDB dataset — where a handful of popular movies account for a disproportionate share of rows in tables like movie_info and movie_keyword — is exactly the environment where optimizer estimates break down and feedback shines.
Most improved queries reached their best plan after one FR round; a small number needed additional rounds, with the longest case converging after three.
When FR improves plans: TPC-H examples
TPC-H Q13 is a LEFT JOIN with GROUP BY that computes customer order distributions. It is one of the most network-intensive queries in the benchmark.
After a single FR iteration:FR corrected the join cardinality estimate, chose a better join order, and reduced the volume of data moving across the cluster by nearly a third. Every metric improved. One iteration.
Metric | Before | After | Change |
Elapsed | 8.73s | 6.87s | -21% |
CPU | 181,932ms | 158,337ms | -13% |
Network | 225,862ms | 159,908ms | -29% |
Memory | 11.0 GB·s | 8.8 GB·s | -20% |
TPC-H Q5 (a 6-table equi-join chain) followed the same pattern: -20% elapsed, -23% network, -17% memory — all from a single FR run. TPC-H Q14 shows what happens when a query has multiple estimation errors: the first FR iteration cut network traffic by 41% and reduced elapsed time by 14%; a follow-up iteration refined the aggregation strategy further using the cardinalities observed in round one. FR is not limited to a single correction — each validated run adds signal for the next.
Story 2: The plan FR did not adopt — TPC-H Q2
Not every candidate plan is an improvement. TPC-H Q2 is a 5-table equi-join with a correlated subquery that ranks suppliers by minimum cost for a given part type. Structurally it is similar to Q5 — the 6-table join chain that FR improved by 20%. Both are multi-table joins on the same dataset. But Q2's original plan was already well-served by its statistics.
FR profiled Q2, generated a candidate plan with a different join order, executed it, and compared. The candidate's measured task CPU (~8,500ms) showed no improvement over the original. FR skipped it. The query stayed at its baseline across all iterations, unchanged.
Metric | Iteration 0 | Iteration 4 | Change |
Elapsed | 0.42s | 0.41s | unchanged |
CPU | 8,617ms | 8,626ms | unchanged |
Network | 10,447ms | 10,267ms | unchanged |
Memory | 22.7 MB·s | 22.6 MB·s | unchanged |
This is an important nuance: correcting a cardinality estimate does not guarantee a better plan. The optimizer may already have found the right join order despite the wrong estimate, or the corrected estimate may push the search toward a region that happens to be worse for other reasons. When that happens, FR's validation step catches it. The candidate is discarded, the original plan stays live, and the system avoids keeping speculative changes that do not hold up in real execution.
Across TPC-H's 24 queries, FR generated 38 candidate plans over multiple iterations. Nineteen were committed — those are the improvements reported above. The other nineteen were measured, found not to be better, and discarded. The queries they belonged to kept running on their original plans, undisturbed.
Crucially, even when FR skips a candidate, the learning is not lost. The runtime observations collected during that execution — actual row counts, join cardinalities, memory consumption — still accumulate in FR's feedback store. They inform the next reoptimization attempt, and they are available to cross-query feedback for other queries that share the same join patterns. A skipped plan is a failed experiment, but the data from that experiment stays.
Story 3: A real production case
In one recent self-managed customer case, a recurring analytical query joining roughly ten tables over large reference tables ran with a badly misordered plan. At a critical inner join, the optimizer estimated about 211 million rows, but the actual output was about 718 million. That underestimate pushed the optimizer into a right-join reordering that built the hash table on the large side, creating a ~718-million-row intermediate. The result was a 14-second execution with roughly 232 GB of memory, versus about 5 seconds with a manual STRAIGHT_JOIN hint, and about 30 GB of memory with a session-level join-order workaround.
The first FR run did not solve the whole query. It corrected several base-table and subquery estimates, but the new join order exposed join subsets FR had never seen before. On one of those newly explored joins, the optimizer fell back to a heuristic estimate of about 100 rows for a result that actually produced about 762 million rows, so that iteration still made a bad downstream decision. The key lesson is that FR was learning, but it did not yet have enough coverage of the join tree to finish the job in one round.
Support then had the customer keep running FR iteratively in the same session. By the third FR round, the query had converged on the stronger plan: it outperformed the original plan and the manual workaround profiles while using less memory. This is exactly the kind of production pattern FR is built for. On complex, repeated analytical queries, the first feedback round may only move the optimizer into a better region of the search space. The next few rounds let it accumulate enough runtime evidence to stabilize on the better plan.
Getting Started in Three Lines
On SingleStore 9.0 and later, FR is designed to be on by default. These three settings are the recommended baseline for core FR:
1-- Step 1: Enable auto-profiling on complex queries2SET GLOBAL enable_auto_profile = TRUE;3SET GLOBAL auto_profile_type = SMART;4
5-- Step 2: Enable the FR execution pipeline6SET GLOBAL enable_automatic_feedback_reoptimization = ON;7
8-- Step 3: Let the engine automatically identify candidates9SET GLOBAL optimizer_feedback_reoptimization_auto_marking = AUTO;
If you are on a freshly deployed 9.0+ cluster, these are likely already set. The checklist above confirms nothing has been turned off.
Tuning a specific slow query
If you already have a query you want FR to work on now, you do not need to wait for automatic detection:
1-- Find the plan ID for your query2SHOW PLANCACHE;3
4-- Mark it for reoptimization on next execution5REOPTIMIZE MARK <plan_id>;6
7-- After the query runs, inspect what changed8SELECT plan_id, reoptimize_state, optimizer_notes9FROM information_schema.PLANCACHE10WHERE plan_id = <plan_id>;
The optimizer_notes column tells you what FR changed between the old and new plan, what the measured improvement was, and whether the plan has converged.
Monitoring system-wide FR activity
1SHOW FEEDBACK REOPTIMIZATION STATUS;
This gives you a cluster-level view: how many plans have been marked, how many have converged, and what the distribution of improvements looks like across your workload.
On 9.1+, let idle time do more of the work
If you are running SingleStore 9.1 or later, you can also enable Idle Cluster Feedback Reoptimization (ICFR):
1SET GLOBAL enable_idle_cluster_feedback_reoptimization = ON;
With ICFR enabled, you do not need to babysit individual plans. Keep running your normal workload, and let the cluster use idle windows to quietly reoptimize high-impact queries in the background. Over time, that means the plans behind recurring dashboards, reports, and service-side analytics can keep getting better without forcing you to stop and manually tune each one.
Just as with the rest of FR, safety comes first: user workloads keep priority, and the previously validated plan remains available if a newly tested plan does not hold up in real traffic.
When FR won't help
FR is the right tool when the problem is estimate error. It is not the right tool when the problem is something else:
- Parameter-sensitive queries that genuinely need different plans for different input values — FR picks one plan per query shape. Consider query rewrites or plan pinning instead.
- Very short queries — FR deliberately avoids very short queries. The overhead is not worth it.
- Schema or design problems — if a query is slow because of a missing index, a bad shard key, or an inherently expensive query pattern, FR can only explore alternatives within the same design. Fix the underlying issue first.
What's Next
Feedback Reoptimization in SingleStore 9.0 addresses the core problem: plans that are bad because estimates were wrong. It gives the optimizer a way to learn from real execution instead of relying only on stale assumptions.
But there is more to do.
The next area we are exploring is memory-pressure driven reoptimization. Today, FR focuses on queries where cardinality misestimation leads to bad join order or distribution choices. Out-of-memory failures caused by underestimated intermediates are a related but distinct problem — one where the stakes are higher (the query fails, not just slows) and where feedback from the executor could drive a different class of plan changes. This is an active area of work.
We are also continuing to extend cross-query feedback to cover more query shapes and to integrate more tightly with the plan cache so that cardinality observations from one query propagate faster and more broadly to related queries in the workload.
The broader vision is an optimizer that treats every query execution as an opportunity to learn — not just about that query, but about the workload as a whole. Statistics give the optimizer a starting point. Feedback is how it gets better over time.
If you are running SingleStore 9.0 or later, the starting point is already there. Run your workload, and let it learn.