Observability Agent lets you ask about the health of your SingleStore workspace in plain language and get an answer grounded in your own monitoring data. People bring questions like these to a running system:
- Show me how CPU, memory, and disk behaved on this cluster over the last hour, and whether any node is an outlier.
- Which queries used the most resources in the last thirty minutes, and how often did they fail?
- Why did this pipeline slow down between these two times?
- Did a resize, a node event, or a memory event line up with the failures I saw this afternoon?
- Compare read and write throughput before and after this morning, and tell me what changed.
Each of these is a question someone would otherwise answer by hand, if they knew how. The agent does the reading, follows the evidence from one signal to the next, and stops when the cause is clear. It shows its work, so the answer is something you can check rather than something you have to trust on faith.
Take a common data observability problem: lagging pipeline. The agent reviews its state, recent changes, throughput, resource usage, and errors. It checks whether a cluster event or operation coincided with the slowdown, then explains the likely cause and what to investigate next, in the time it takes to read the reply.
What our observability agent will and will not do
The agent diagnoses. It does not act on your behalf. It will not change your data, alter configuration, resize infrastructure, or stop a workload. It explains what is happening and recommends what to do, and the decision stays with you.
The agent also stays inside your permissions. Every request runs under the same Helios role-based access control you already have, so the agent can only investigate the workspaces you can reach and can only read the data you are entitled to read.
Both of these are deliberate. An agent that troubleshoots production is only useful if you can hand it a live problem without worrying about what it might touch, and only trustworthy if its answers stay within the boundaries you already set.
You can start from a chart that looks wrong, hand it to the agent, and ask what is going on. The agent picks up the cluster and the time window from what you were looking at, and takes it from there.
From symptom to cause on a real cluster
A production workspace started returning memory errors mid-morning. The error named the limit it had hit and almost nothing about why:
Leaf Error: Memory used by MemSQL (99782.12 Mb) has reached the 'maximum_memory'
setting (99983 Mb) on this node. Possible causes include (1) available query
execution memory has been used up for table memory (in use table memory:
7676.00 Mb) and (2) the query is large and complex and requires more query
execution memory than is available (in use query execution memory 83537.69 Mb).
The team had already done the obvious checks. Then they reported it as a critical production incident. The first read was fast and correct. Memory was accumulating in query execution rather than table memory, so the standard guidance applied: reduce the workload, or scale the workspace up.
Correct, and not very helpful. The team wrote back with the question that actually mattered. They could see the console's Query category filling up. They could not see what was inside it, and "reduce your workload" is not an instruction you can act on when you do not know which workload.
What finding the cause normally takes
Answering "which workload" by hand means assembling one picture from four places:
- The Cluster Detailed View, for the shape of the memory curve.
- Historical Workload Monitoring, to see what was running before the errors started.
- Cluster trace logs, through Loki or a cluster report, for the errors themselves.
- An allocator breakdown via
SHOW STATUS EXTENDED, to establish which category of memory is actually growing.
Then the step that takes the longest: pulling the same time window from previous days and comparing it against today by hand, looking for the workload that is present now and was not before.
The observability tools are separate, and the sequence for using them only exists in the heads of people who have run this investigation before. Budget one to three hours, assuming you already know the route. Remember this time we show you how much time our agent took in a real customer incident resolution.
What the observability agent did
We gave the agent the error and the window the customer reported, and let it work. It followed the evidence in order.
The agent ruled out table memory first. Table memory stayed flat across the whole window, at roughly the 7.7 GB the error itself reports. Query execution memory went from about 2.4 GB to over 70 GB inside a single five-minute interval. A step change rather than gradual growth, which rules out table memory as the consumer and points the investigation at what was running rather than at what was stored.
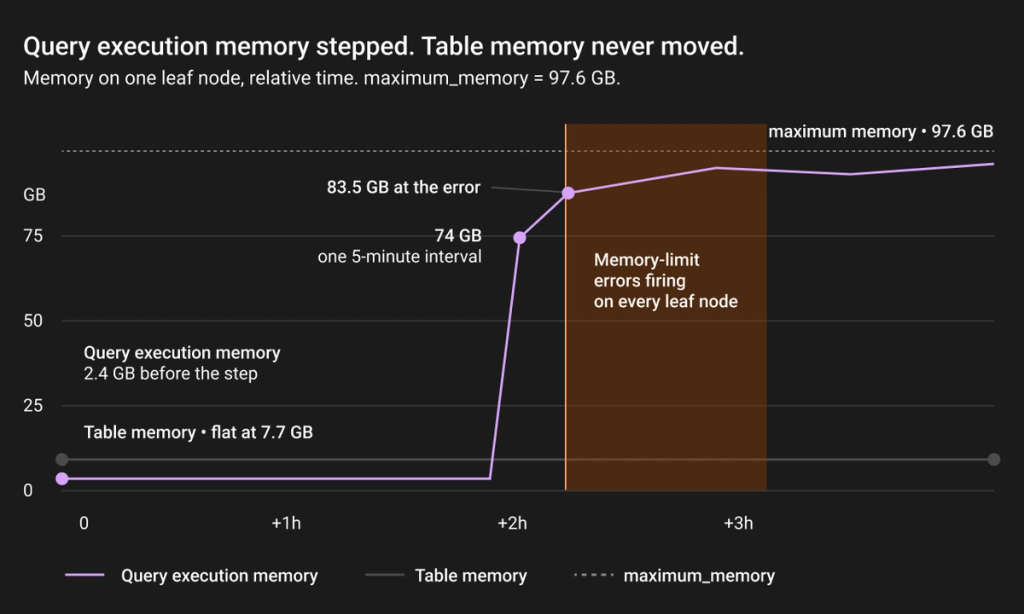
Aggregated Memory usage chart
Next, the agent ranked workloads by memory rather than by duration. This is why the team's own check came up empty. They had looked for a long-running query, and the ceiling was being reached by the aggregate of several attempts running at once. There was no single query to find.
Activity | Database | Memory (GB-samples) | Executions | Failures | Spill (GB) |
SelectReport_A_v1 | reporting | 1,000,722 | 130 | 104 (80%) | 0 |
SelectReport_A_v2 | reporting | 811,085 | 61 | 51 (84%) | 0 |
RunPipeline_B | reporting | 17,141 | 72 | 72 (100%) | 0 |
SelectReport_A_v3 | reporting | 13,853 | 4 | 4 (100%) | 2.06 |
InsertSelect_B | reporting_migration | 13,176 | 3 | 0 | 0 |
SelectReport_C | reporting | 1,788 | 9 | 9 (100%) | 40.11 |
GB-samples is memory summed across monitoring samples, so the column ranks sustained memory pressure rather than peak size. Read as shares, the picture is blunt. The top two rows together account for 97.5% of the memory attributed across these six, and the third-ranked workload is under 2% of the first. They are also two variants of the same report query.
Failure rates revealed the actual finding. Both were failing 80 to 84% of the time.
The agent connected the failures to the memory pressure. A workload that dominates memory attribution and fails four times out of five is a workload being retried, and each attempt takes its share of memory again before failing again. The condition that made the queries fail was being sustained by the queries themselves. Memory-limit errors eventually fired on every leaf node and continued for about an hour.
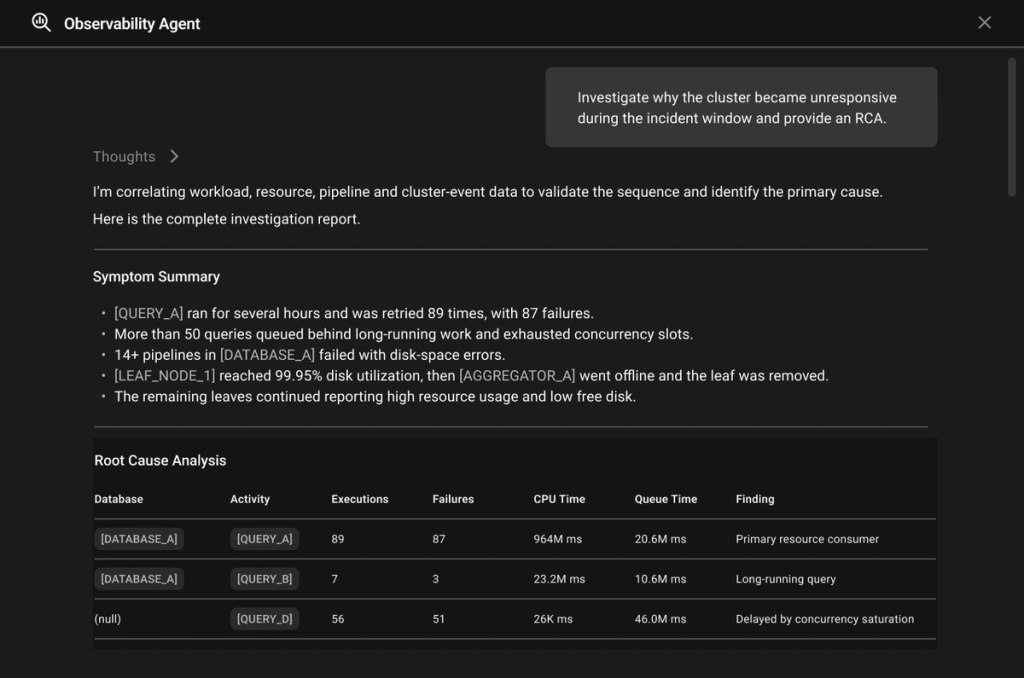
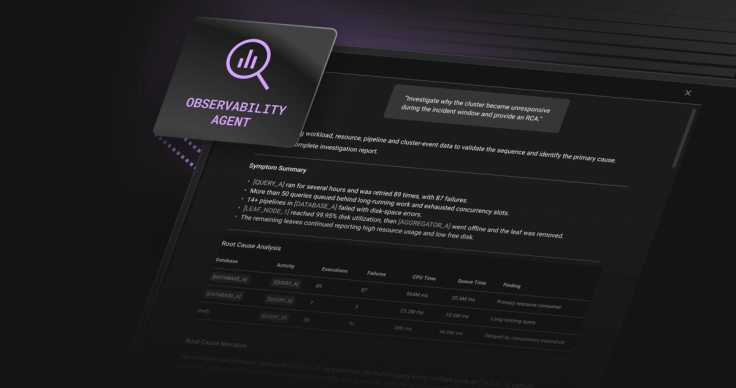
Example of Agent Response
Why the second answer was different from the first
The first answer was "reduce your workload or scale up." The second named the option to change: find the Looker report generating the SelectReport_A variants and throttle it, because a workload failing 80% of the time and retrying is making the problem worse on every cycle. Scaling up stayed on the table, but it was no longer the only lever, and on its own it might simply have given the retry loop more room to fill.
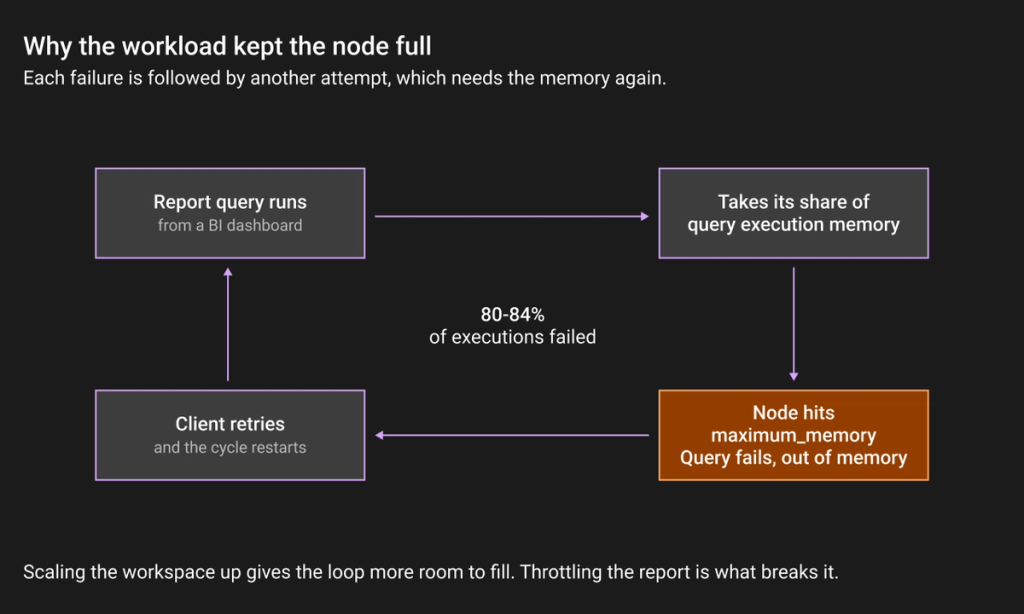
Memory exhaustion pattern
The agent also flagged something new. SelectReport_C had spilled more than 40 GB to disk while hitting memory limits, a second source of pressure that would have kept causing trouble after the first one was fixed.
The agent produced a ranked, evidence-based explanation with the dashboards behind it, and handed a specific, checkable finding to the people who could act on it.
The customer acknowledged the analysis, said they would investigate the highlighted queries, and the ticket was closed.
Time the agent to reach that conclusion: Around 2 minutes, from the pasted error to the ranked list of findings to act on.
Why we built it on SingleStore
SingleStore already holds the data observability signals behind these investigations, including cluster health, workload history, and pipeline activity for Helios. Each step of the investigation asked something different. "Is table memory growing" reads one metric over time. "Which workload is consuming the memory" groups five hours of query history by every distinct query in it, then ranks the result. "How often did those two fail" goes back to the same history and slices it another way.It is hard to plan that sequence, because each question only exists once the previous answer lands. Precomputed rollups do not help here: a rollup answers a question someone thought of in advance, and so does a dashboard. An investigation is whatever the last answer forces you to ask next. That is what makes two minutes possible. An agent following evidence can, and will chase a wrong lead sometimes, and it can only afford to do that if the wrong lead costs another query instead of another minute. Singlestore is one of the DBs in the market where you can afford to do this in a few minutes.
How the agent knows where to look
The agent did not improvise its way through that incident. Rule out table memory first. Rank workloads by memory rather than by duration. Check failure rates on whatever comes out on top. That is the order our own engineers use on a memory-pressure ticket, written down as a playbook the agent picks up when the symptom matches.
Investigations rarely run in a straight line. This one turned when the team pushed back on the first answer, which is the normal case rather than the exception. The agent holds on to the evidence it has already gathered, so an objection narrows the investigation instead of restarting it.
The result is repeatability. The same symptom, from a different person in a different cluster, gets worked the same way.
How to try the observability agent
You can reach it from the portal, and from the observability dashboards, where you can send a panel and its time window straight into a conversation and ask the agent to explain it. The best results come from a specific question. Tell it the cluster or workspace, the window of time you care about, and what you actually observed.
The first release is for the person who has a problem in front of them and wants an answer without becoming an expert in our monitoring stack first. Look out for our support agent that will help you act on these observations that we aim to ship next. We are also working on making these agents available securely through MCP clients, served by our remote MCP server. We are rolling this out to a select group of customers. If you would like to try it, reach out to our support and product teams to reduce effort spent in investigating.