The Setup
As a performance engineer at SingleStore, one of my primary responsibilities is to ensure that customer Proof of Concepts (POCs) run smoothly. I was recently asked to assist with a big POC, where I was surprised to encounter an uncommon Linux performance issue. I was running a synthetic workload of 16 threads (one for each CPU core). Each one simultaneously executed a very simple query (select count(*) from t where i > 5) against a columnstore table.
In theory, this ought to be a CPU bound operation since it would be reading from a file that was already in disk buffer cache. In practice, our cores were spending about 50% of their time idle:

In this post, I’ll walk through some of the debugging techniques and reveal exactly how we reached resolution.
What were our threads doing?
After confirming that our workload was indeed using 16 threads, I looked at the state of our various threads. In every refresh of my htop window, I saw that a handful of threads were in the D state corresponding to “Uninterruptible sleep”:
 PID USER      PRI  NI  VIRT   RES   SHR S CPU% MEM%   TIME+  Command
55308 neil       21   1 11.6G 3825M 36804 S 530.  3.4 21h44:11 ./memsqld
55969 neil       20   0 11.5G 3825M 36804 R 35.8  3.4 30:31.52 ./memsqld
56121 neil       20   0 11.6G 3825M 36804 D 35.8  3.4 34:55.03 ./memsqld
56120 neil       20   0 11.6G 3825M 36804 D 34.4  3.4 36:27.53 ./memsqld
56109 neil       20   0 11.6G 3825M 36804 R 33.7  3.4 31:57.14 ./memsqld
56088 neil       20   0 11.6G 3825M 36804 D 33.7  3.4 50:08.92 ./memsqld
56099 neil       20   0 11.6G 3825M 36804 D 33.7  3.4 31:58.06 ./memsqld
56069 neil       20   0 11.6G 3825M 36804 R 33.1  3.4 31:01.54 ./memsqld
56101 neil       20   0 11.6G 3825M 36804 D 32.4  3.4 28:41.27 ./memsqld
56104 neil       20   0 11.6G 3825M 36804 D 32.4  3.4 31:54.41 ./memsqld
55976 neil       20   0 11.5G 3825M 36804 D 32.4  3.4 30:18.72 ./memsqld
55518 neil       20   0 11.5G 3825M 36804 D 32.4  3.4 29:48.51 ./memsqld
55966 neil       20   0 11.5G 3825M 36804 D 32.4  3.4 36:51.50 ./memsqld
55971 neil       20   0 11.5G 3825M 36804 R 32.4  3.4 27:22.96 ./memsqld
55959 neil       20   0 11.5G 3825M 36804 D 32.4  3.4 38:13.50 ./memsqld
55975 neil       20   0 11.5G 3825M 36804 R 31.7  3.4 30:18.38 ./memsqld
Why were we going off CPU?
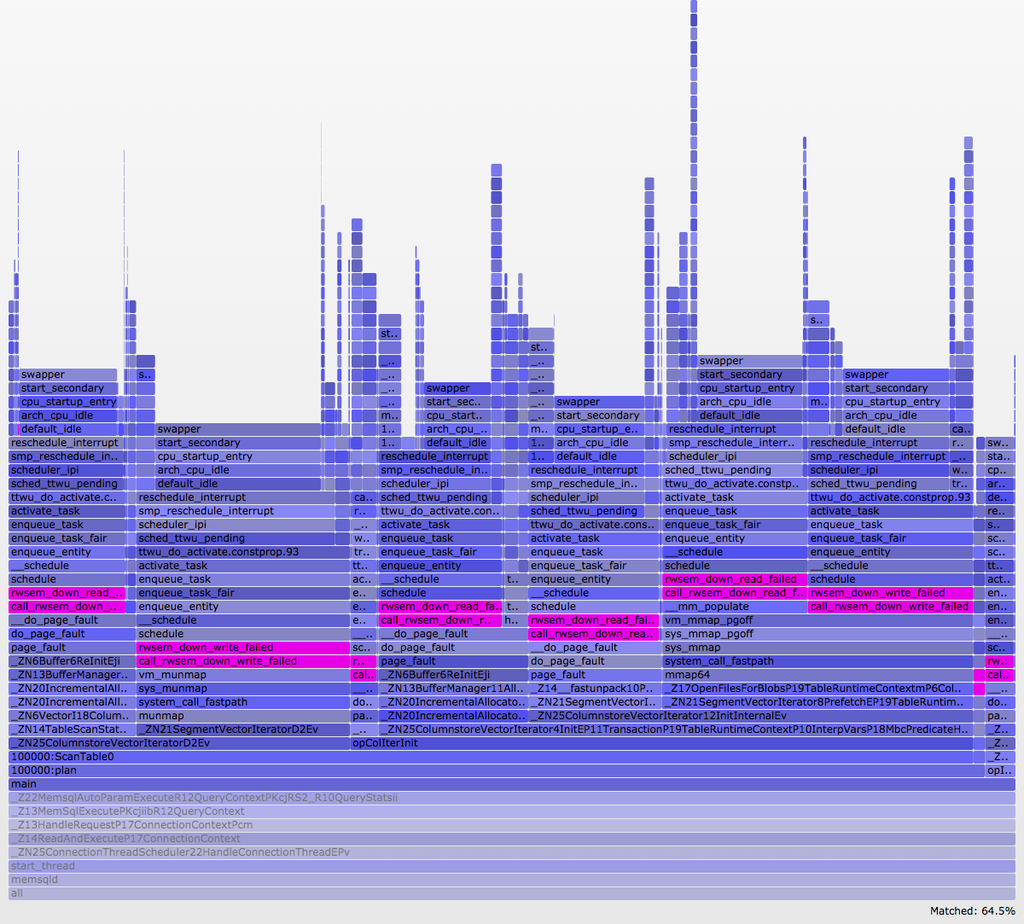
At this point, I generated an off-cpu flamegraph using Linux perf_events to see why we entered this state. Off-CPU means that instead of looking at what is keeping the CPU busy, you look at what is preventing it from being busy by things happening elsewhere (e.g. waiting for IO or a lock). The normal way to generate these visualizations is to use perf inject -s, but the machine I tested on did not have a new enough version of perf. Instead I had to use an `awk` script I had previously written:
$ sudo perf record --call-graph=fp -e 'sched:sched_switch' -e 'sched:sched_stat_sleep' -e 'sched:sched_stat_blocked' --pid $(pgrep memsqld | head -n 1) -- sleep 1
    [ perf record: Woken up 1 times to write data ]
    [ perf record: Captured and wrote 1.343 MB perf.data (~58684 samples) ]
$ sudo perf script -f time,comm,pid,tid,event,ip,sym,dso,trace -i sched.data | ~/FlameGraph/stackcollapse-perf-sched.awk | ~/FlameGraph/flamegraph.pl --color=io --countname=us >off-cpu.svg
Note: recording scheduler events via `perf record` can have a very large overhead and should be used cautiously in production environments. This is why I wrap the `perf record` around a `sleep 1` to limit the duration.

In an off-cpu flamegraph, the width of a bar is proportional to the total time spent off cpu. Here we see a lot of time is spent in rwsem_down_write_failed.
From the repeated calls to rwsem_down_read_failed and rwsem_down_write_failed, we see that culprit was mmapcontending in the kernel on the mm->mmap_sem lock:
down_write(&mm->mmap_sem);
ret = do_mmap_pgoff(file, addr, len, prot, flag, pgoff,
                    &populate);
up_write(&mm->mmap_sem);
This was causing every mmap syscall to take 10-20ms (almost half the latency of the query itself). SingleStore was so fast that that we had inadvertently written a benchmark for Linux mmap!
$ sudo perf trace -emmap --pid $(pgrep memsqld | head -n 1) -- sleep 5
    ... <snip> ...
    12453.692 ( 9.060 ms): memsqld/55950 mmap(len: 1265444, prot: READ, flags: PRIVATE|POPULATE, fd: 65) = 0x7f95ece9f000
    12453.777 ( 8.924 ms): memsqld/55956 mmap(len: 1265444, prot: READ, flags: PRIVATE|POPULATE, fd: 67) = 0x7f95ecbf5000
    12456.748 (15.170 ms): memsqld/56112 mmap(len: 1265444, prot: READ, flags: PRIVATE|POPULATE, fd: 77) = 0x7f95ec48d000
    12461.476 (19.846 ms): memsqld/56091 mmap(len: 1265444, prot: READ, flags: PRIVATE|POPULATE, fd: 79) = 0x7f95ec1e3000
    12461.664 (12.226 ms): memsqld/55514 mmap(len: 1265444, prot: READ, flags: PRIVATE|POPULATE, fd: 84) = 0x7f95ebe84000
    12461.722 (12.240 ms): memsqld/56100 mmap(len: 1265444, prot: READ, flags: PRIVATE|POPULATE, fd: 85) = 0x7f95ebd2f000
    12461.761 (20.127 ms): memsqld/55522 mmap(len: 1265444, prot: READ, flags: PRIVATE|POPULATE, fd: 82) = 0x7f95ebfb9000
    12463.473 (17.544 ms): memsqld/56113 mmap(len: 1265444, prot: READ, flags: PRIVATE|POPULATE, fd: 75) = 0x7f95eb990000
    ... <snip> ...
The fix was simple — we switched from using mmap to using the traditional file read interface. After this change, we nearly doubled our throughput and became CPU bound as we expected:

For more information and discussion around Linux performance, check out the original post on my personal blog.
Download SingleStore Community Edition to run your own performance tests for free today: singlestore.com/cloud-trial/


.png?width=24&disable=upscale&auto=webp)
.png?height=187&disable=upscale&auto=webp)


