SingleStore Notebooks
New

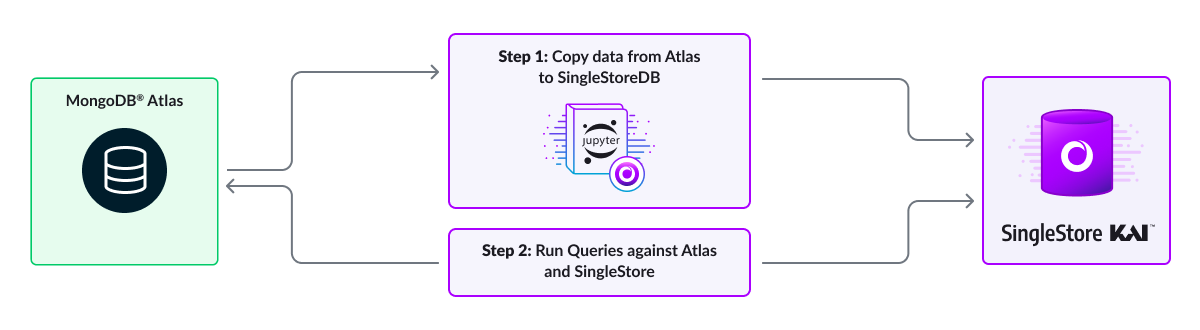


Mongo Atlas & SingleStore Kai
Notebook
Note
This notebook can be run on a Free Starter Workspace. To create a Free Starter Workspace navigate to Start using the left nav. You can also use your existing Standard or Premium workspace with this Notebook.
No code change required! 100% MongoDB notebook!
Given the small dataset, the objective of that notebook is not to compare performance.
What you will learn in this notebook:
Install libraries and import modules
Connect to a MongoDB Atlas and SingleStore Kai endpoints
Copy Atlas collections into SingleStore - Synthetic collections are about retail sales transactions with customer information
Compare performance on same code from simple to more complex queries
Document counts
Product quantity sold
Average customer satisfaction
Average satisfaction per product
Number of transactions by Location and membership
Top 10 product sales
1. Install libraries and import modules
Make sure that you have a created MongoDB enabled workspace.
This must be done when creating a workspace (for Standard/Premium Workspaces) For Starter Workspaces, the KAI API will be on by default.
In [1]:
1!pip install pymongo pandas matplotlib plotly ipywidgets --quiet
In [2]:
1shared_tier_check = %sql show variables like 'is_shared_tier'2
3if shared_tier_check and shared_tier_check[0][1] == 'ON':4    current_database = %sql SELECT DATABASE() as CurrentDatabase5    database_to_use = current_database[0][0]6else:7    database_to_use = "new_transactions"8    %sql CREATE DATABASE {{database_to_use}}
Action Required
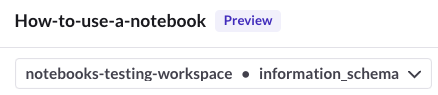
Make sure to select a database from the drop-down menu at the top of this notebook. It updates the connection_url to connect to that database.
In [3]:
1import os2import time3
4import numpy as np5import pandas as pd6import plotly.express as px7import plotly.subplots as sp8import pymongo9from pymongo import MongoClient10from plotly.offline import plot, iplot, init_notebook_mode
2. Connect to Atlas and SingleStore Kai endpoints
We are using a shared tier on the backend for Atlas
In [4]:
1# No need to edit anything2myclientmongodb = pymongo.MongoClient("mongodb+srv://mongo_sample_reader:SingleStoreRocks27017@cluster1.tfutgo0.mongodb.net/?retryWrites=true&w=majority")3mydbmongodb = myclientmongodb["new_transactions"]4mongoitems = mydbmongodb["items"]5mongocusts = mydbmongodb["custs"]6mongotxs = mydbmongodb["txs"]
Select the workspace that you want to use.
In [5]:
1s2clientmongodb = pymongo.MongoClient(connection_url_kai)2s2dbmongodb = s2clientmongodb[database_to_use]3s2mongoitems = s2dbmongodb["items"]4s2mongocusts = s2dbmongodb["custs"]5s2mongotxs = s2dbmongodb["txs"]
3. Copy Atlas collections into SingleStore Kai
In [6]:
1mongocollections = [mongoitems, mongocusts, mongotxs]2
3for mongo_collection in mongocollections:4    df = pd.DataFrame(list(mongo_collection.find())).reset_index(drop=True)5    data_dict = df.to_dict(orient='records')6    s2mongo_collection = s2dbmongodb[mongo_collection.name]7    s2mongo_collection.insert_many(data_dict)
Count documents in SingleStore
In [7]:
1mg_count = s2mongoitems.count_documents({})2mg_count
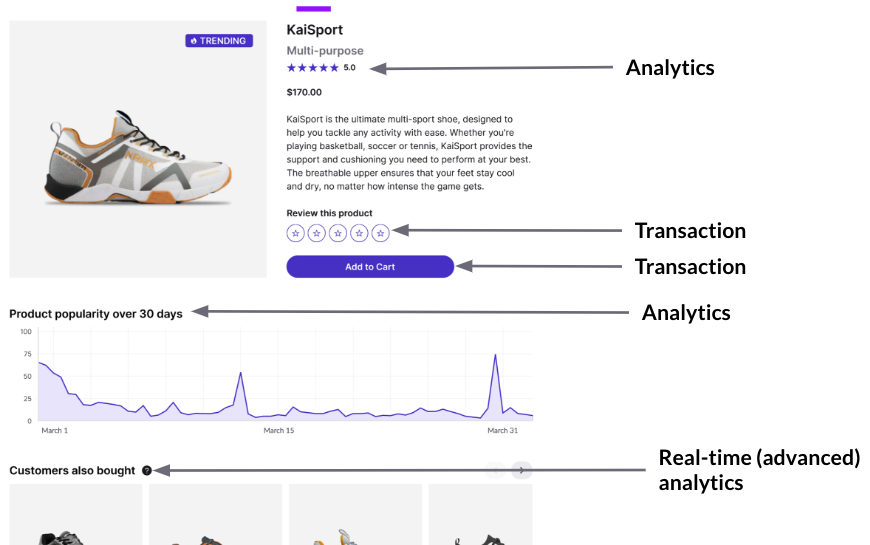
Compare Queries and Performance
In-app analytics is everywhere.
4. Document counts
In [8]:
1num_iterations = 102mongo_times = []3
4for i in range(num_iterations):5    mg_start_time = time.time()6    mg_count = mongoitems.count_documents({})7    mg_stop_time = time.time()8    mongo_times.append(mg_stop_time - mg_start_time)9
10s2_times = []11for i in range(num_iterations):12    s2_start_time = time.time()13    s2_count = s2mongoitems.count_documents({})14    s2_stop_time = time.time()15    s2_times.append(s2_stop_time - s2_start_time)16
17df = pd.DataFrame.from_dict({18    'iteration': list(range(1, num_iterations + 1)),19    'mongo_times': mongo_times,20    's2_times': s2_times,21})22
23df_2 = pd.DataFrame.from_dict({24    'counts': [mg_count, s2_count],25    'connection_type': ["mongodb", "singlestore"],26})27
28figures = [29    px.line(df.iloc[1:], x='iteration', y=['mongo_times', 's2_times']),30    px.bar(df_2, x="connection_type", y="counts", color="connection_type")31]32
33fig = sp.make_subplots(rows=1, cols=2, subplot_titles=["Document Count Execution Time","Document Counts"])34for i, figure in enumerate(figures):35    for trace in range(len(figure["data"])):36        fig.append_trace(figure["data"][trace], row=1, col=i + 1)37
38fig.update_yaxes(title_text="Time in Seconds", row=1, col=1)39fig.update_xaxes(title_text="Iteration", row=1, col=1)40fig.update_xaxes(title_text="Iteration", row=1, col=1)41fig.update_xaxes(tickmode='array', tickvals=[1, 2, 3, 4, 5,6,7,8,9,10], row=1, col=1)42
43fig
5. Product Quantity Sold
In [9]:
1num_iterations = 102mongo_times = []3
4pipeline = [5    {"$group": {"_id": "$item.name", "totalQuantity": {"$sum": "$item.quantity"}}},6    {"$sort": {"totalQuantity": -1}},7    {"$limit": 5},8]9
10for i in range(num_iterations):11    mg_start_time = time.time()12    mg_result = mongoitems.aggregate(pipeline)13    mg_stop_time = time.time()14    mongo_times.append(mg_stop_time - mg_start_time)15
16s2_times = []17for i in range(num_iterations):18    s2_start_time = time.time()19    s2_result = s2mongoitems.aggregate(pipeline)20    s2_stop_time = time.time()21    s2_times.append(s2_stop_time - s2_start_time)22
23x_axis = list(range(1, num_iterations + 1))24data = {25    'iteration': x_axis,26    'mongo_times': mongo_times,27    's2_times': s2_times,28}29df = pd.DataFrame.from_dict(data)30
31item_names = []32item_quantity = []33for i in mg_result:34    item_names.append(i["_id"])35    item_quantity.append(i["totalQuantity"])36
37figures = [38    px.line(df.iloc[1:], x='iteration', y=['mongo_times', 's2_times']),39    px.bar(x=item_names, y=item_quantity)40]41
42fig = sp.make_subplots(rows=1, cols=2, subplot_titles=["Execution Time","Comparison of Product Quantity Sold"])43for i, figure in enumerate(figures):44    for trace in range(len(figure["data"])):45        fig.append_trace(figure["data"][trace], row=1, col=i+1)46
47fig.update_yaxes(title_text="Time in Seconds", row=1, col=1)48fig.update_xaxes(title_text="Iteration", row=1, col=1)49fig.update_xaxes(title_text="Iteration", row=1, col=1)50fig.update_xaxes(tickmode='array', tickvals=[1, 2, 3, 4, 5, 6, 7, 8, 9, 10], row=1, col=1)51
52fig
6. Average Customer Satisfaction
In [10]:
1num_iterations = 102mongo_times = []3
4pipeline = [5    {'$group':6         {7          '_id': '$customer.email',8          'average_satisfaction': {'$avg': '$customer.satisfaction'},9         },10    },11    {'$limit': 10},12]13
14for i in range(num_iterations):15    mg_start_time = time.time()16    mg_result = mongotxs.aggregate(pipeline)17    mg_stop_time = time.time()18    mongo_times.append(mg_stop_time - mg_start_time)19
20s2_times = []21for i in range(num_iterations):22    s2_start_time = time.time()23    s2_result = s2mongotxs.aggregate(pipeline)24    s2_stop_time = time.time()25    s2_times.append(s2_stop_time - s2_start_time)26
27x_axis = list(range(1, num_iterations + 1))28data = {29    'iteration': x_axis,30    'mongo_times': mongo_times,31    's2_times': s2_times,32}33df = pd.DataFrame.from_dict(data)34
35item_names = []36item_quantity = []37for i in mg_result:38    item_names.append(i["_id"])39    item_quantity.append(i["average_satisfaction"])40
41figures = [42    px.line(df.iloc[1:], x='iteration', y=['mongo_times', 's2_times']),43    px.bar(x=item_names, y=item_quantity)44]45
46fig = sp.make_subplots(rows=1, cols=2, subplot_titles=["Execution Time","Average Customer Satisfaction"])47for i, figure in enumerate(figures):48    for trace in range(len(figure["data"])):49        fig.append_trace(figure["data"][trace], row=1, col=i+1)50
51fig.update_yaxes(title_text="Time in Seconds", row=1, col=1)52fig.update_xaxes(title_text="Iteration", row=1, col=1)53fig.update_xaxes(title_text="Iteration", row=1, col=1)54fig.update_xaxes(tickmode='array', tickvals=[1, 2, 3, 4, 5, 6, 7, 8, 9, 10], row=1, col=1)55
56fig
7. Average Satisfaction per Product
In [11]:
1num_iterations = 102mongo_times = []3
4pipeline = [5    {"$lookup":6         {7          "from": "txs",8          "localField": "tx_id",9          "foreignField": "transaction_id",10          "as": "transaction_links",11         }12    },13    {"$limit": 10 },14    {"$unwind": "$transaction_links"},15    {"$group":16        {17         "_id": {"item": "$item.name"},18         "Average Satisfaction": {"$avg": "$transaction_links.customer.satisfaction"}19        }20    }21]22
23for i in range(num_iterations):24    mg_start_time = time.time()25    mg_result = mongoitems.aggregate(pipeline)26    mg_stop_time = time.time()27    mongo_times.append(mg_stop_time - mg_start_time)28
29s2_times = []30for i in range(num_iterations):31    s2_start_time = time.time()32    s2_result = s2mongoitems.aggregate(pipeline)33    s2_stop_time = time.time()34    s2_times.append(s2_stop_time - s2_start_time)35
36x_axis = list(range(1, num_iterations + 1))37data = {38    'iteration': x_axis,39    'mongo_times': mongo_times,40    's2_times': s2_times,41}42df = pd.DataFrame.from_dict(data)43
44item_names = []45item_quantity = []46for i in mg_result:47    item_names.append(i["_id"]['item'])48    item_quantity.append(i["Average Satisfaction"])49
50figures = [51    px.line(df.iloc[1:], x='iteration', y=['mongo_times', 's2_times']),52    px.bar(x=item_names, y=item_quantity)53]54
55fig = sp.make_subplots(rows=1, cols=2, subplot_titles=["Execution Time","Average Satisfaction per Product"])56for i, figure in enumerate(figures):57    for trace in range(len(figure["data"])):58        fig.append_trace(figure["data"][trace], row=1, col=i+1)59
60fig.update_yaxes(title_text="Time in Seconds", row=1, col=1)61fig.update_xaxes(title_text="Iteration", row=1, col=1)62fig.update_xaxes(title_text="Iteration", row=1, col=1)63fig.update_xaxes(tickmode='array', tickvals=[1, 2, 3, 4, 5, 6, 7, 8, 9, 10], row=1, col=1)64
65fig
8. Number of transactions by location and membership
In [12]:
1num_iterations = 102mongo_times = []3
4pipeline = [5    {"$lookup":6         {7          "from": "custs",8          "localField": "customer.email",9          "foreignField": "email",10          "as": "transaction_links",11         }12    },13    {"$limit": 100},14    {"$group":15        {16         "_id": {17                  "location": "$store_location",18                  "membership": "$transaction_links.membership"19                 },20         "count": {"$sum": 1}21        }22    },23    {"$sort": {"count":-1}}24]25for i in range (num_iterations):26    mg_start_time = time.time()27    mg_result = mongotxs.aggregate(pipeline)28    mg_stop_time = time.time()29    mongo_times.append(mg_stop_time - mg_start_time)30
31s2_times = []32for i in range (num_iterations):33    s2_start_time = time.time()34    s2_result = s2mongotxs.aggregate(pipeline)35    s2_stop_time = time.time()36    s2_times.append(s2_stop_time - s2_start_time)37
38x_axis = list(range(1, num_iterations + 1))39data = {40    'iteration': x_axis,41    'mongo_times': mongo_times,42    's2_times': s2_times,43}44df = pd.DataFrame.from_dict(data)45
46item_names = []47item_quantity = []48for i in mg_result:49    toadd = i["_id"]['location'] + ', ' + i["_id"]['membership'][0]50    item_names.append(toadd)51    item_quantity.append(i['count'])52
53figures = [54    px.line(df.iloc[1:], x='iteration', y=['mongo_times', 's2_times']),55    px.bar(x=item_names, y=item_quantity)56]57
58fig = sp.make_subplots(rows=1, cols=2, subplot_titles=["Execution Time","Sales per Store"])59for i, figure in enumerate(figures):60    for trace in range(len(figure["data"])):61        fig.append_trace(figure["data"][trace], row=1, col=i+1)62
63fig.update_yaxes(title_text="Time in Seconds", row=1, col=1)64fig.update_xaxes(title_text="Iteration", row=1, col=1)65fig.update_xaxes(title_text="Iteration", row=1, col=1)66fig.update_xaxes(tickmode='array', tickvals=[1, 2, 3, 4, 5, 6, 7, 8, 9, 10], row=1, col=1)67
68fig
9. Top 10 Product Sales
In [13]:
1num_iterations = 102mongo_times = []3pipeline = [4    {"$project":5        {6         "item": 1,7         "revenue": {"$multiply": ["$item.price", "$item.quantity"]}8        }9    },10    {"$group":11        {12         "_id": "$item.name",13         "total_revenue": {"$sum": "$revenue"}14        }15    },16    {"$sort": {"total_revenue": -1}},17    {"$limit": 10},18]19
20for i in range (num_iterations):21    mg_start_time = time.time()22    mg_result = mongoitems.aggregate(pipeline)23    mg_stop_time = time.time()24    mongo_times.append(mg_stop_time - mg_start_time)25
26s2_times = []27for i in range (num_iterations):28    s2_start_time = time.time()29    s2_result = s2mongoitems.aggregate(pipeline)30    s2_stop_time = time.time()31    s2_times.append(s2_stop_time - s2_start_time)32
33x_axis = [i + 1 for i in range(num_iterations)]34data = {35    'iteration': x_axis,36    'mongo_times': mongo_times,37    's2_times': s2_times,38}39df = pd.DataFrame.from_dict(data)40
41item_names = []42item_quantity = []43for i, result in enumerate(mg_result):44    if i >= 1:45        toadd = result["_id"]46        item_names.append(toadd)47        item_quantity.append(result['total_revenue'])48
49figures = [50    px.line(df.iloc[1:], x='iteration', y=['mongo_times', 's2_times']), # Exclude the first iteration from the line chart51    px.bar(x=item_names, y=item_quantity)52]53
54fig = sp.make_subplots(rows=1, cols=2, subplot_titles=["Execution Time","Top 10 Product Sales"])55for i, figure in enumerate(figures):56    for trace in range(len(figure["data"])):57        fig.append_trace(figure["data"][trace], row=1, col=i+1)58
59fig.update_yaxes(title_text="Time in Seconds", row=1, col=1)60fig.update_xaxes(title_text="Iteration", row=1, col=1)61fig.update_xaxes(title_text="Iteration", row=1, col=1)62fig.update_xaxes(tickmode='array', tickvals=[1, 2, 3, 4, 5, 6, 7, 8, 9, 10], row=1, col=1)63
64fig
Clean up
Action Required
If you created a new database in your Standard or Premium Workspace, you can drop the database by running the cell below. Note: this will not drop your database for Free Starter Workspaces. To drop a Free Starter Workspace, terminate the Workspace using the UI.
In [14]:
1shared_tier_check = %sql show variables like 'is_shared_tier'2if not shared_tier_check or shared_tier_check[0][1] == 'OFF':3 %sql DROP DATABASE IF EXISTS new_transactions;
Details
About this Template
Run your MongoDB queries on SingleStore Kai with no code change.
This Notebook can be run in Shared Tier, Standard and Enterprise deployments.
Tags
startermongokai
See Notebook in action
Launch this notebook in SingleStore and start executing queries instantly.
License
This Notebook has been released under the Apache 2.0 open source license.