The Workload Monitoring UI allows SingleStore users to analyze their clusters' workloads. They can do this by viewing all of the activities that ran during a specific period of time, as well as each query’s resource usages (CPU, network, disk I/O, etc.) and other properties. In this blog post, we explain how we implemented the graphical interface for this feature.
What is Workload Monitoring?
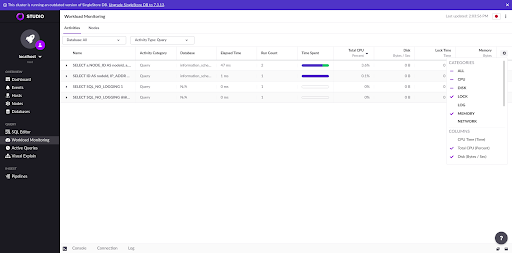
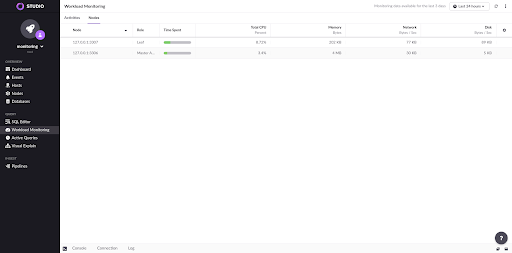
Workload Monitoring is a visual UI currently implemented in SingleStore Studio on top of the Workload Profiling SingleStore database feature. The goal of Workload Monitoring is to allow the user to analyze a specific cluster workload. Each query has information such as time spent across CPU usage, memory access, disk I/O access, as well as other metrics. The following screenshot shows the Activities page where you can see the recorded queries as well as choose the properties the user can filter by.
How is Workload Monitoring implemented?
There are two ways to retrieve the data — one can record the cluster usage in real time in the UI, or rely on a set of data that is continuously being collected (usually referred to as "historical monitoring").
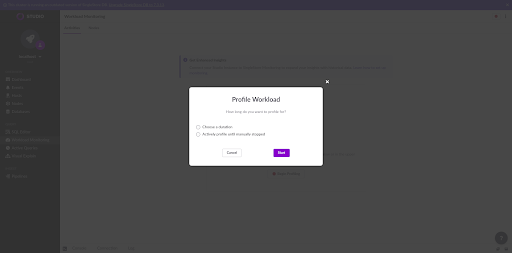
The first one implies a manual start in the Workload Monitoring page in Studio. The user can choose between recording for a fixed time interval, or manually starting and stopping the recording in the UI. Both processes follow similar approaches: they sample data from the cluster and show what activities were running during the time interval.
When you select a fixed interval, the frontend runs SET SESSION activities_delta_sleep_s = <interval>. This query will set a session variable to be used when running the query that retrieves the activities — SELECT * FROM INFORMATION_SCHEMA.MV_ACTIVIES_EXTENDED. This query will take "activities_delta_sleep_s" seconds to respond and then finally return a list of activities which ran during the time period as well as all the resource statistics about these activities.
(Queries and other "tasks" that run within SingleStore are referred to as "activities". So, a SQL query run by a user will be made up of more than one activity, but other jobs such as backups will also generate activities. The resource usage of these can sometimes be relevant too, but it's usually queries that matter the most.)
If the user chooses to start and stop the recording manually, the outcome is the same but it’s executed a bit differently. When the recording starts, the activities are retrieved from the mv_activities_extended_cumulative table and saved in memory. This table returns all activities which ever ran in the cluster, keyed by their activity name. For each activity, the table returns its various metrics with a cumulative, always increasing value. Here's a sample row from this table for an INSERT SQL query:
*************************** 894. row ***************************
                    NODE_ID: 3
              ACTIVITY_TYPE: Query
              ACTIVITY_NAME: Insert_trade_ab59956168a51a79
   AGGREGATOR_ACTIVITY_NAME: insert_trade_25c621542ce291e1
              DATABASE_NAME: trades
               PARTITION_ID: 1
                CPU_TIME_MS: 2498
           CPU_WAIT_TIME_MS: NULL
            ELAPSED_TIME_MS: 19746
           LOCK_ROW_TIME_MS: 0
               LOCK_TIME_MS: 0
               DISK_TIME_MS: NULL
            NETWORK_TIME_MS: 0
         LOG_BUFFER_TIME_MS: 0
          LOG_FLUSH_TIME_MS: 16996
LOG_BUFFER_LARGE_TX_TIME_MS: 0
     NETWORK_LOGICAL_RECV_B: 0
     NETWORK_LOGICAL_SEND_B: 1171283
         LOG_BUFFER_WRITE_B: 2231793
        DISK_LOGICAL_READ_B: 31016
       DISK_LOGICAL_WRITE_B: 110
       DISK_PHYSICAL_READ_B: NULL
      DISK_PHYSICAL_WRITE_B: NULL
                  MEMORY_BS: 525
        MEMORY_MAJOR_FAULTS: NULL
 PIPELINE_EXTRACTOR_WAIT_MS: 0
 PIPELINE_TRANSFORM_WAIT_MS: 0
    LAST_FINISHED_TIMESTAMP: 2021-09-15 07:15:09
                  RUN_COUNT: 0
              SUCCESS_COUNT: 31882
              FAILURE_COUNT: 0
When the recording stops, activities are retrieved again from the same cumulative table. Both activity groups are compared and the frontend takes the ones that were running by calculating the delta between starting and ending activity groups. We do this by filtering the activities which have a higher run count in the second group than in the first as well as activities that show up on the second group but not on the first. This process ensures that only the activities that have changed during the recording are shown.
For activities which are present in both groups, we have to get the delta value of all metrics' cumulative values. As an example, if a query spent 4000 milliseconds in CPU time in the first snapshot and 4300 milliseconds in CPU time in the second snapshot, then this activity spent 300 milliseconds in CPU time during the interval that's being analyzed. Because we're dealing with always-increasing cumulative values, we need to be careful with overflows. This can be tricky because SingleStore returns these counters as 64 bit integers but the frontend can only hold 53 bit integers. So, the frontend has to parse the numbers as strings and use bignumber.js to perform all computations.
Note that when the recording is in progress, the user is free to navigate between pages, run queries and interact with the cluster. The results are displayed when the interval ends or when the user chooses to stop the profiling.
The second approach, the historical monitoring, requires some configuration at the cluster level. You can see in our documentation how to configure this. The process involves designating a database to monitor the cluster, allowing it to ingest data, and configuring the Studio state file to have access to this database (the monitoring database can live in an external cluster as well).
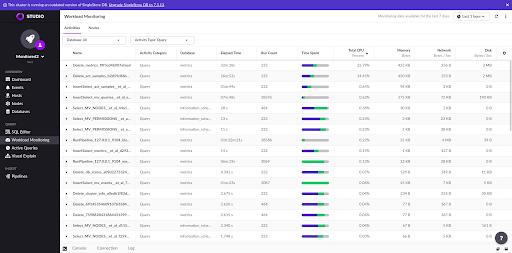
The SingleStore pipeline functionality allows for the data to be easily ingested into the monitoring database. From the user's point of view, when this kind of monitoring is enabled, the Workload Monitoring page doesn't show any "recording" feature but rather just displays all the activities in the last hour by default. The user can then choose to select any past time interval they'd like. Of course, the monitoring data will only be available from the moment one sets up their monitoring database.
With historical monitoring, the user is free to choose any time interval and analyze the workload that was running then. Here, the frontend is still doing the exact same calculations as when a user chooses to record usage manually, but not running the same queries as before. Instead, the frontend queries the historical database (which could potentially involve connecting to another cluster, if the monitoring database is not stored locally), which contains a table very similar to mv_activities_extended_cumulative, but with an extra column called timestamp. The frontend will take the activity groups for two timestamp values and perform the same computations described earlier.
Besides all this, there are a lot of other computations that occur in order to provide a good user experience. These mainly include unit conversions, but the frontend also has to group activities and sub-activities correctly. Since SingleStore is a distributed database, all queries in SingleStore are composed by sub-activities running in its various nodes. The frontend should therefore show the node breakdown when the activity is expanded.
Moreover, it also displays the raw information in a more graphical and aesthetically pleasing way by taking all the time spent by a query to execute and showing colorful bars that display a breakdown of where a query is spending its time. This is very helpful to diagnose various types of problems. For example, if all queries are spending an inordinate amount of time waiting for disk, there may be a problem with the disk performance of the machines where SingleStore nodes are running.
Finally, the UI also supports browsing resource usage by node which is done by deriving the necessary information from the raw activities data and then grouping it by node.
Future Plans
This is a feature that is currently part of our Studio product for self-managed customers. However, we have been working on extracting it from Studio and implementing it in our Singlestore Helios UI as well. Our plan is to have it available to both sets of users soon.