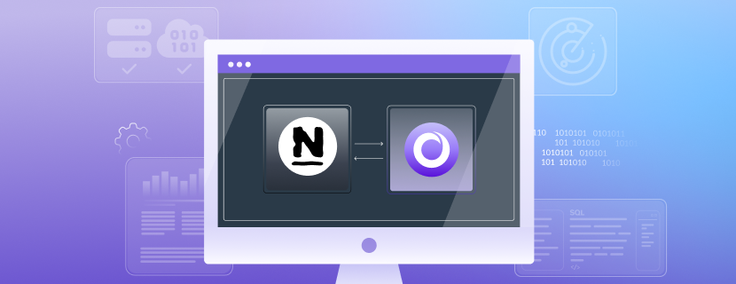
Nagios XI is a monitoring and alerting tool that monitors infrastructure, including database services. Nagios XI provides the capability to foresee big problems before they affect critical business processes. In this blog, we’ll walk through how system administrators and DBAs configure Nagios XI and monitor SingleStoreDB clusters.
What Is SingleStoreDB?
SingleStoreDB is a real-time, distributed SQL database. With familiar SQL tooling and MySQL wire protocol compatibility, SingleStoreDB eliminates the need for specialized databases and simplifies database architectures.
SingleStoreDB is also built to handle multiple data types (including JSON, time-series, geospatial and full-text search) — delivering high-speed data ingestion on a unified transactional and analytical foundation.
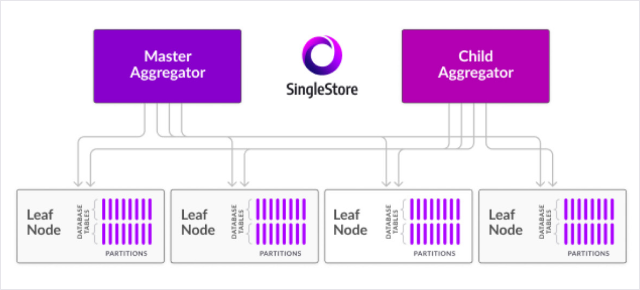
SingleStoreDB Architecture
What Is Nagios XI?
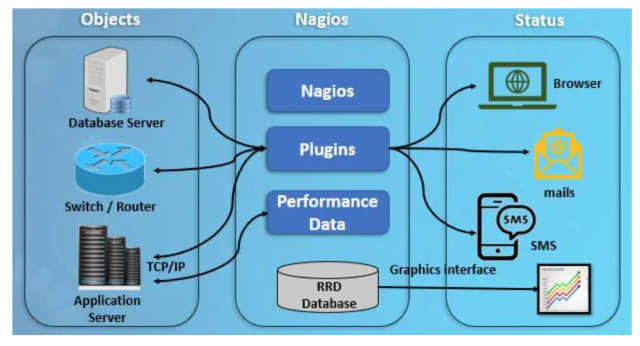
Nagios XI provides monitoring of infrastructure components including applications, services, operating systems, network protocols, systems metrics and networks, with hundreds of additional inbuilt-plugins.
Nagios Architecture
How to Setup Nagios XI and SingleStore
Step 1:
Download and Install MySQL as your database (for metadata) using the following link
Download: https://dev.mysql.com/downloads/mysql/
Install: https://dev.mysql.com/doc/refman/8.0/en/linux-installation-rpm.html
Post installation: Create database named “nagios”
Step 2:
Download the package and installation Nagios XI
Download: curl https://assets.nagios.com/downloads/nagiosxi/install.sh | sh
That one command will download and install Nagios XI. Please proceed to the “Finalize Installation” section.
Alternatively, you can install Nagios XI by issuing the following commands in your terminal session:
cd /tmp
wget https://assets.nagios.com/downloads/nagiosxi/xi-latest.tar.gz
Step 3:
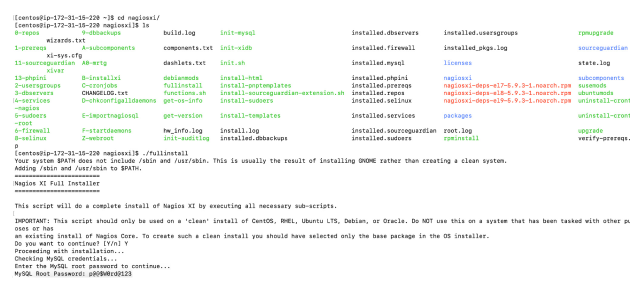
Start installation
tar xzf xi-latest.tar.gz
cd nagiosxi
./fullinstall
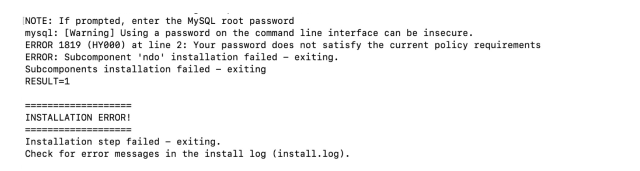
Step 4 (optional): Error and troubleshooting
If you face the following password error while moving through installation, please ensure your password satisfies the current policy requirement — or to streamline the process, create a simple password. For this example, I set the password as “password123”
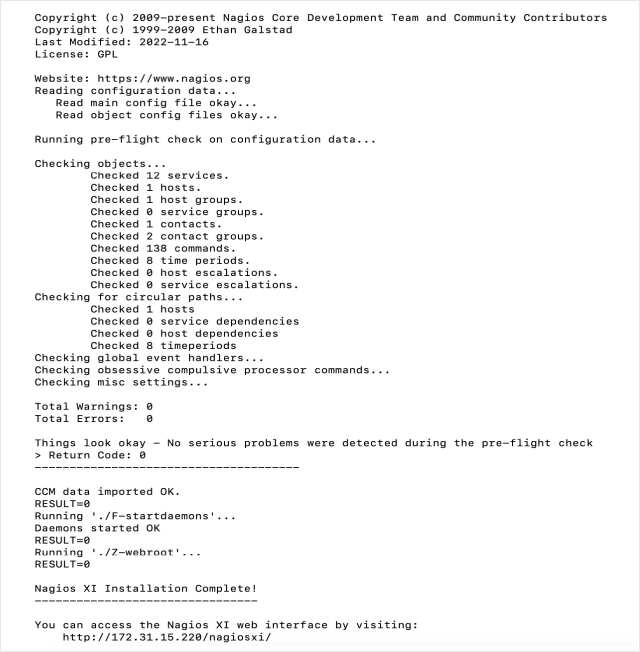
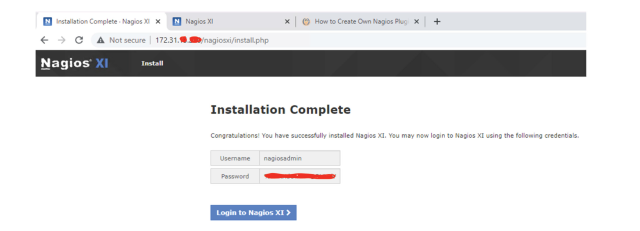
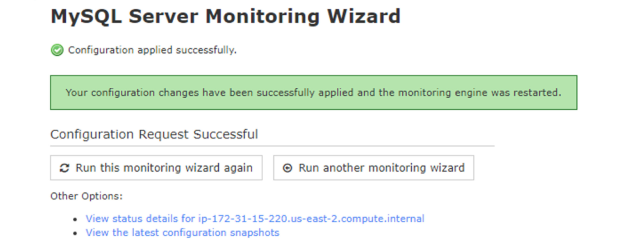
Step 5: After successful installation, you will see the following output:
Step 7: After installation you can access the Nagios XI web interface as seen here:
Step 6: SingleStoreDB download and installation
On-premises
Please follow the instructions here to download and install SingleStoreDB
Singlestore Helios: Get $600 worth of free usage
Spin up your cluster on the cloud of your choice (AWS/GC/Azure) using the link here
Integrating Nagios XI and SingleStore for Monitoring
Once we set up the complete environment we covered above, we can integrate Nagios XI and SingleStoreDB to start monitoring the server. There are two ways to monitor SingleStoreDB through Nagios XI
- Basic monitoring through the configuration wizard
- Advanced monitoring with custom plug-ins
Basic Monitoring
SingleStore can be monitored using the MySQL protocol available in the configuration wizard.
Step 1
Go to the “Configure” tab and choose “Configuration Wizard” from the drop-down menu. Click the database option from the window.
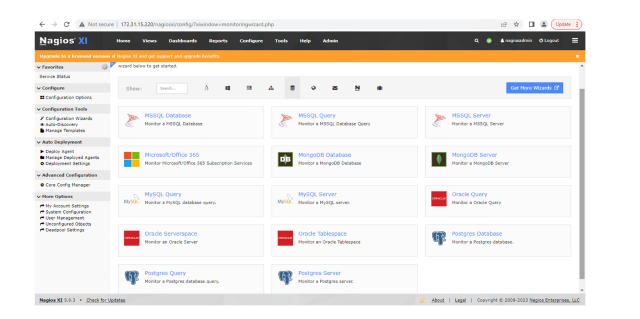
Step 2
Since SingleStoreDB is a MySQL wire-compatible database, you can choose to use a MySQL database. To monitor SingleStoreDB queries, choose the “MySQL Query” option — you can also monitor basic SingleStoreDB server metrics using the same option. Use the SingleStoreDB master aggregator IP and related information to fill in the configuration wizard.
In this example, we are going to show how we can monitor basic server metrics in SingleStoreDB. These metrics are:
Connection time : Monitor the time it takes to connect to the server
- Uptime: Monitor the time the MySQL/SingleStoreDB server has been running. Lower numbers are worse, and indicative of the server having been restarted
- Open connections monitor: The number of currently open connections
- Long running processes: Monitor the number of long running processes
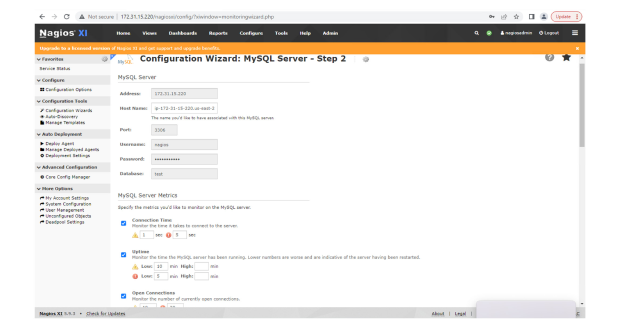
You’ll set the warning and critical threshold as per your criticality of the metrics.
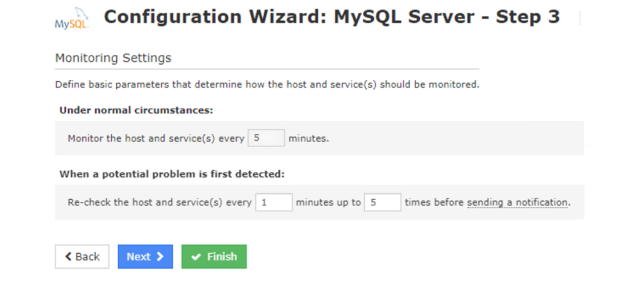
Step 3
Set the time interval limit. Nagios can monitor these metrics and if problems start, you’ll be able to see them within the intervals. Click on “Finish.”
Step 4
In the last step you can see the successful applied configuration setting.And now to monitor the metrics, you can click on the link “view status details for <host>”
You can also view all the added hosts in the tab “View Hosts” and monitor them. The dashboard will look like this, and is actively monitoring all the metrics.
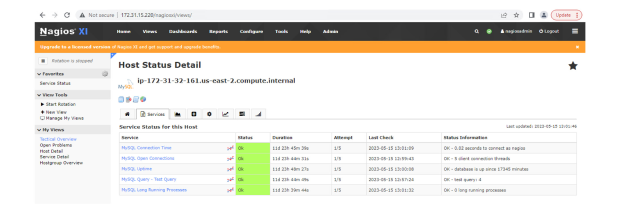
Let's choose one status from the five available to take a closer look — we’ll use“SingleStore/MySQL”. This status shows historical/current concurrency on a SingleStoreDB cluster.
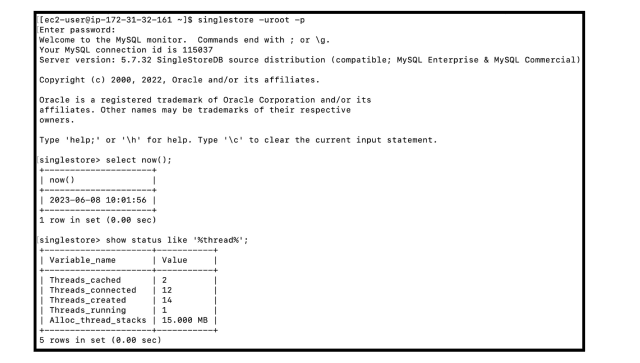
Cluster view (12 concurrent threads at 10:00a.m.):
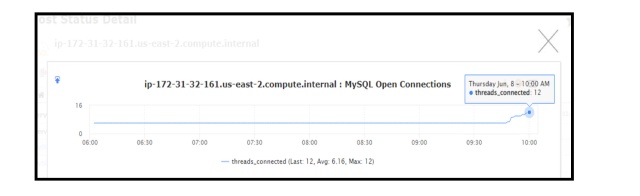
Nagios XI view (12 concurrent threads at 10:00a.m.):
Advanced Monitoring with Custom Plug-ins
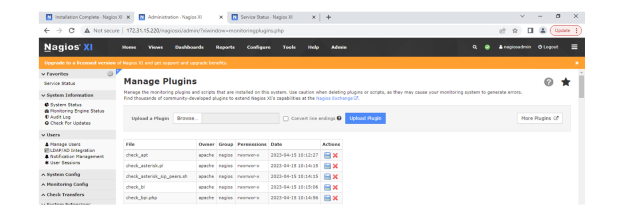
Advance level monitoring for SingleStoreDB metrics can be achieved through the plug-ins feature in Nagios XI. You can add new plug-ins — or change existing plugins — based on your requirements. To navigate plug-ins in Nagios:
Go to the “Configure” menu and find Core Config Manager. Click on “Monitoring Plugins” link in the left-hand side of the window.
You can upload new plug-ins, download plugins and delete existing ones.