

Editor’s note: Running these benchmarks and documenting the results is truly a team effort. In addition to John Sherwood, Eric Hanson and Nick Kline authored this blog post.
If you’re anything like us, you probably roll your eyes at “company benchmarks its own software, writes a post about it.” This of course raises a question: if we’re cynical industry veterans, numb from the constant deluge of benchmarketing … why are we writing this? Simple: we wanted to prove to ourselves that we’re the only modern, scalable database that can do a great job on the three well-known database benchmarks, TPC-C, TPC-H, and TPC-DS, which cover both OLTP and data warehousing. Now, we hope to get you to suspend your skepticism long enough for us to prove our capabilities to you.
SingleStore’s primary focus is on what we call operational analytics (you might have heard this referred to as HTAP, translytical, or HOAP), running analytical queries across large, constantly changing datasets with consistently high performance. This performance is provided through the use of scale-out, compilation of queries to machine code, vectorized query execution, and use of single instruction, multiple data (SIMD) instructions. Our operational analytics capability blurs OLTP and data warehouse (DW) functionality, and different use cases take advantage of different slices of our spectrum of capabilities.
To test some of the new features in our upcoming 7.0 release, we used multiple TPC benchmarks to push SingleStore beyond what our normal everyday stress tests can reach. Our results show that we can do both transaction processing and data warehousing well, and we scale well as workload size increases. No other scale-out database running on industry-standard hardware can do this.
Playing Fair
TPC benchmarks have a certification process, and we did our best to follow the specifications, but we did not work with TPC to certify the benchmarks, so these are informal results. But we hope it goes without saying that we didn’t cheat. In fact, SingleStore does not have any “benchmark specials” (features designed just to make the benchmark result better, but that nobody would ever use for a real application) built into the code.
The TL;DR
This is a long post because we wanted to write an in-depth overview of how we ran the benchmarks so you can see how we achieved all these results. But if you want just a quick summary, here’s how we did on the benchmarks.
- TPC-C: SingleStore scaled performance nearly linearly over a scale factor of 50x.
- TPC-H: SingleStore’s performance against other databases varied on this benchmark, but was faster than multiple modern scale-out database products that only support data warehousing.
- TPC-DS: SingleStore’s performance ranged from similar, to as much as two times faster than other databases. Expressed as a geometric mean, as is often done for benchmarking results, our performance was excellent.
What we accomplished was solid performance across three distinct benchmarks, establishing SingleStore as a top choice database for operational analytics and cloud-native applications. Now let’s move on to the details of the benchmarks.
TPC-C: Scale-out OLTP
On the massively transactional side of the spectrum, we have the TPC-C benchmark. To quote the 1997 SIGMOD presentation announcing it, a benchmark is a “distillation of the essential attributes of a workload,” and TPC-C distills the absolute hell out of a sharded transactional workflow. As the scale (defined by the number of warehouse facilities being emulated) increases, the potential parallelism increases as well. From our perspective, this is ideal for discovering any bottlenecks in our own code.
Our TPC-C database design used single tables for the large data sets, allowing us to use an existing driver targeting MySQL. Unlike some other official results published by major database vendors, we did not artificially split the data into multiple separate tables to reduce locking and contention. The way we ran the benchmark is much simpler, and shows how our scale-out architecture can make application development easier.
While experimenting with smaller datasets, we quickly discovered that driving significant load required us to nearly match the CPU of the aggregators with the leaves in the cluster. This configuration, strong all over (“very Schwarzenegger”, as one of our engineers put it) is quite unusual; it’s rare that customers require such a ratio of aggregators to leaves.
In part, our internal benchmarking service colocates drivers on aggregators, which required us to size up boxes to have the extra CPU. Additionally, under the pure OLTP TPC-C workload, aggregators are primarily coordinating transaction state and are effectively concurrency bound.
As we would recommend for a real workload of this nature, we had redundancy and synchronous replication enabled. This means that there are two copies of every data partition on two different nodes for high availability (HA), and transaction commits are not acknowledged to the client until both the primary and secondary replicas are updated. This of course requires twice the memory compared to running without HA, and adds to transaction overhead, since row updates must be applied on the replica node before the commit. This cost is to be expected if HA with fast failover is required. If you want HA, you need to pay.
After experimenting with smaller datasets, we drove just over 800,000 transactions per minute (tpmC) against 10,000 warehouses, using a cluster with 18 leaves and 18 aggregators, all r3.8xlarge instances. This led us to scale up, moving onto TPC-C at the 50,000 scale. This required what we would term a formidable cluster; storing a single replica of the data (including indexes) required more than 9 TB of RAM.
For HA, we stored two copies of the data, which, after some fairly straightforward math, took us to almost 20 TB. We decided to use r5.metal instances, using 2x the leaf instances, for a total of 6x the cores compared to the 10,000 warehouse cluster. Notably, the only change we made in running the benchmark itself was in tuning the partition count and hash index buckets; from the perspective of the open source benchmark driver we were using, originally written for MySQL, everything just worked.
The last notable thing about our 50,000 warehouse run was that we ran out of hardware from AWS while trying to reach the limit of the cluster; as we had taken 36 hosts for leaves and 21 for aggregators, we suppose that’s pretty reasonable.
With 1,728 physical cores on the leaf nodes for the megacluster (to use the scientific term), it’s hard to argue with calling this “throwing hardware at the problem.” However, as discussed above, we were able to easily meet the same per-core performance as at smaller scales. We feel that our overall results are a strong validation of the performance improvements to our new intra-cluster replication implementation in SingleStoreDB Self-Managed 7.0.
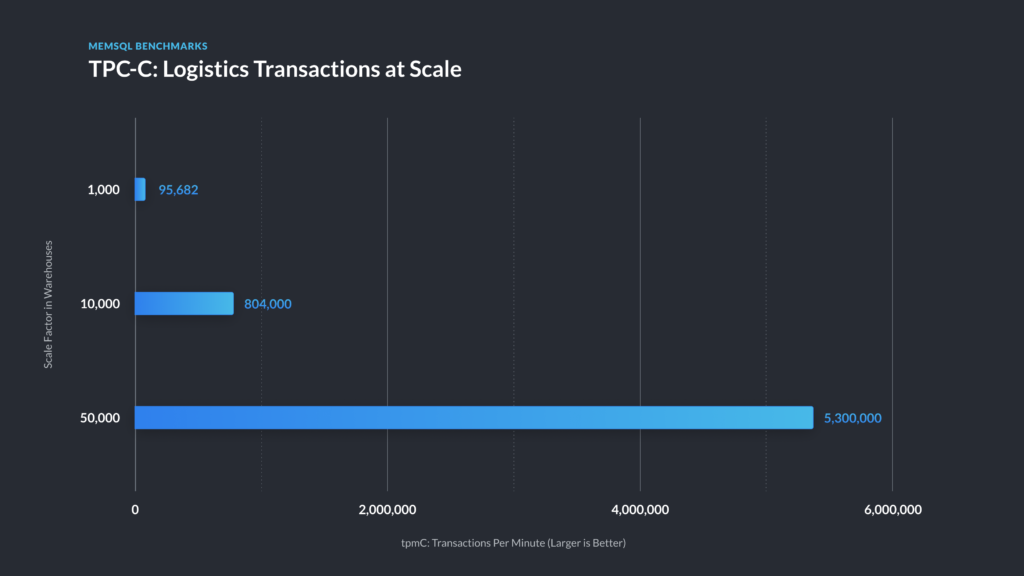
Figure 1 – TPC-C results for SingleStore.
| Scale | vCPUs |
|---|---|
| 1,000 | 48 |
| 10,000 | 576 |
| 50,000 | 3,456 |
Table 1 – Leaf Cores, normalized to vCPUs. This table only includes leaf vCPUs for SingleStore, as we also had to use aggregator CPU to run the benchmark driver instances. Full details are included in Appendix A.
In Table 1, for SingleStore, we show both the number of leaf cores and the total number of cores, including aggregator cores. The way our benchmark kit is designed, it was easiest for us to run the benchmark with this configuration. In addition, our benchmark setup ran the application threads driving the transaction work on the aggregator machines. Normally that is not accounted for in the benchmark results.
The aggregator nodes were not fully utilized, and significantly over-provisioned to drive this test, though we were not able to determine the minimum amount of equipment needed to obtain performance at the level shown in Figure 1. Despite the caveats, these results show the dramatic benefits of our distributed architecture, in-memory skiplist and hash storage structures, and compilation of queries to machine code.
While the above data is a beautiful (in our eyes) illustration of our ability to consume an OLTP firehose, these results are only possible by violating the rate limiting requirement found in the TPC-C specification. TPC-C is intended to emulate a limited number of physical terminals being interacted with by humans, and so more faithful drivers are limited to only pushing a handful of tpmC per warehouse. In a great example of why the TPC and the concept of audited results exist, we explicitly state here that these results are not comparable to others on that basis.
Per-Core Throughput for OLTP
It’s comforting to know that you’re getting your money’s worth as you scale a cluster and workload to larger sizes. Figure 2 illustrates the ability to maintain throughput per core for a transaction processing workload as data and cluster size increase. This translates to roughly linear scalability in throughput as the size of the transaction processing workload increases. Yet you can still run analytical queries across all the data, unlike the common approach of manually sharding large data sets across multiple databases instances with a single-node DBMS, such as Postgres, MySQL, or SQL Server. The nature of SingleStore allows for running analytic-style queries on this data in the same instance that is also handling transaction processing.
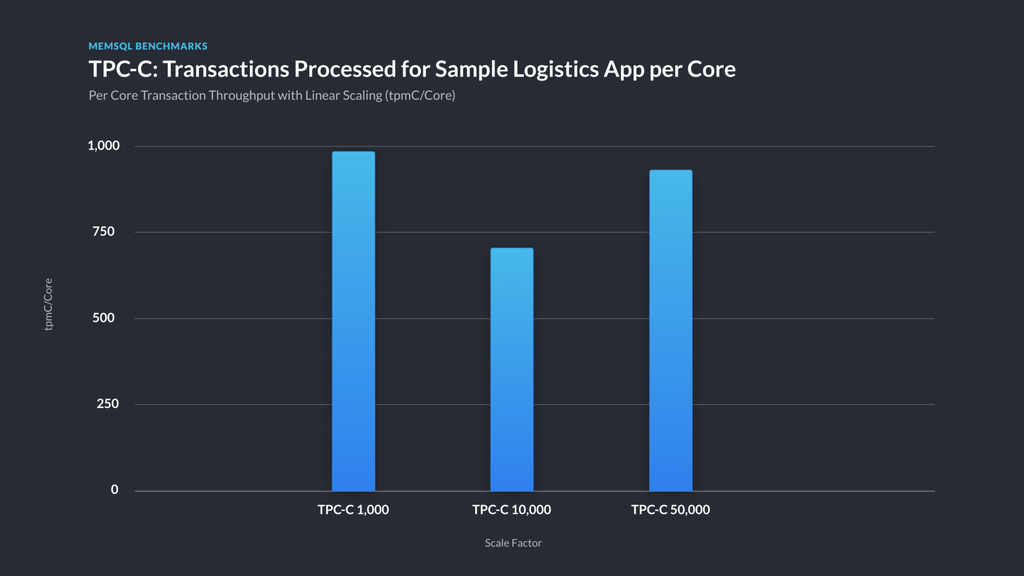
Figure 2 — Per vCPU transaction throughput (includes aggregator vCPUs) . When increasing the dataset size and the hardware to match, SingleStore TPC-C throughput per vCPU held within a 30% band. We had plenty of headroom on the leaves at the 50,000 scale, and could have driven more throughput, but AWS ran out of r5.metal hosts for us to use as benchmark drivers, which was a pretty cool consolation prize in our opinion.
TPC-H and TPC-DS: DW Scalability and Then Some
On the opposite end of the spectrum, we have TPC-H (H) and TPC-DS (DS), categorized by the TPC as “decision support” benchmarks. H and DS use similar datasets, and DS is effectively the next-generation version of H. While H generates fairly straightforward queries and tends to be shard-friendly, DS thrills in its use of advanced SQL features and functions and exhilarates in its lopsided filters. Running DS is notoriously, purposefully difficult, and SingleStore can run all 99 DS queries, while many decision support-oriented databases cannot.
TPC-DS
At scale factor 10,000, the largest TPC-DS table contains just shy of 29 billion rows, with some 24 billion others spread out across the rest of the tables. TPC-DS then runs a set of 99 queries using a formidable array of operators and features against this large data set. Below, we show all published official TPC-DS benchmark results to date [AL19, AL19b, Cis19] , comparing the total query runtimes with our unofficial SingleStore run. In addition, we sought out one more informal result on a well-known cloud data warehouse product, which we refer to as “Cloud DW Product.” Although SingleStore’s core strength is operational analytics, these comparisons show that we also are also competitive with data warehouse and big data products on a very challenging pure data warehouse workload.
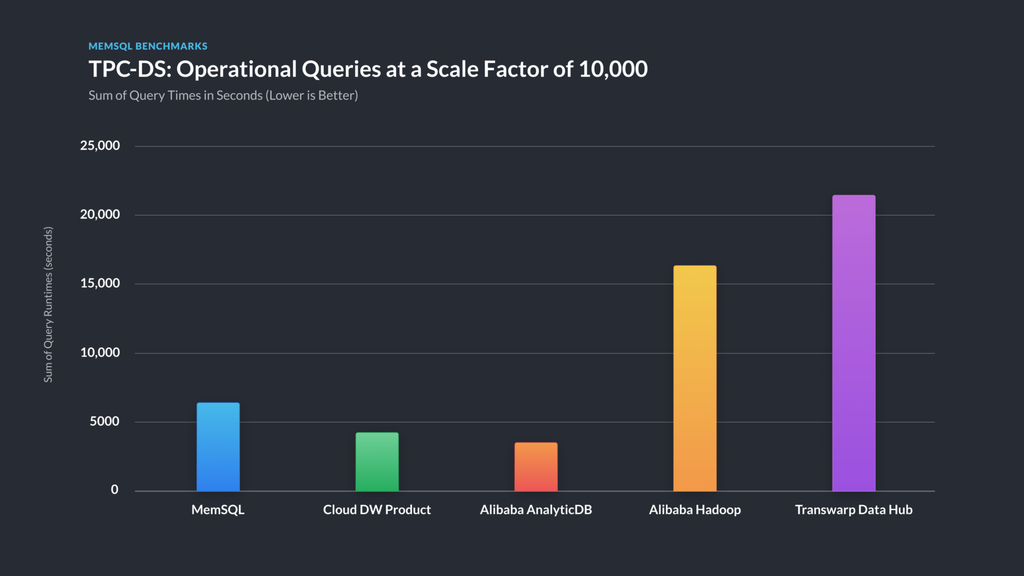
Figure 3 — comparative TPC-DS runtimes at 10TB scale factor — lower is better. For TPC-DS, we performed a ‘power run,’ where the sequential runtime of each query is summed. Please see the differences in benchmark versions and hardware used, described below.
| Product | Physical Cores (not VCPUs) | TPC-DS Version | Is Certified Benchmark Result | Power Run Time (s) | Geometric Mean (s) |
|---|---|---|---|---|---|
| SingleStore | 640 | 1.4.0 | no | 6,495 | 6.03 |
| Cloud DW Product | 32 nodes, unknown size | 1.4.0 | no | 4,481 | 11.03 |
| Alibaba AnalyticsDB | 512 | 2.10.1 | yes | 3,935 | 9.81 |
| Alibaba Hadoop | 520 | 2.10.1 | yes | 16,207 | 81.96 |
| Transwarp Data Hub | 1024 | 2.7.0 | yes | 21,615 | 72.73 |
Table 2 – Hardware used for TPC-DS runs and results, Power Run times, and Geometric Mean times . We normalized to physical cores rather than vCPUs to match TPC usage.
The values displayed in Figure 3 and Table 2 don’t imply a strict ranking of the systems because of the hardware and version differences. Nevertheless, we believe that the overall results illustrate important relative strengths of the different systems, because the hardware for all the systems is of the same order of magnitude in scale, and the queries are largely equivalent between versions.
We’ve included the geometric mean of the results in Table 2. You can calculate the geometric mean as the nth root of the product of n numbers. (For instance, the 9th root of the product of 9 numbers.) The interesting aspect of a geometric mean, when used for benchmark results, is that it de-emphasizes outliers. As a result, many consider it the most useful single value when reporting results of this type.
For the result shown in Figure 3, where we spent about 6,500 seconds to run the queries, we used a cluster consisting of 19 i3.16xlarge leaves and a single i3.16xlarge aggregator instance. With over 600 leaf CPUs, this was certainly a sizable (and, we have been informed by our finance team, expensive) cluster, but still similar in scale to other clusters that successfully completed the benchmark.
TPC-H
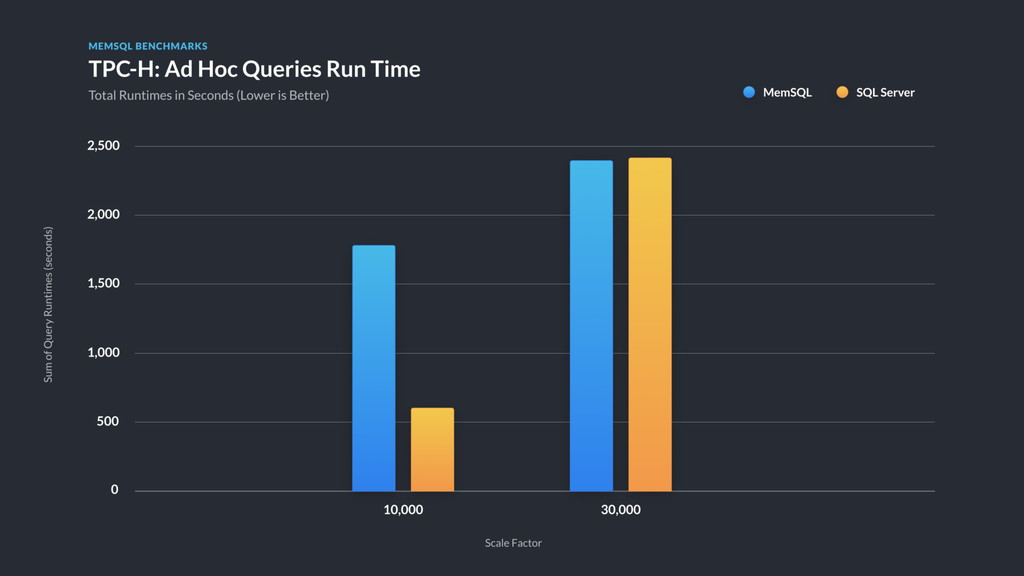
Figure 4 — TPC-H total runtimes comparing SingleStore and SQL Server — smaller is better. We performed the same ‘power run’ with TPC-H as for DS, where the result is the sum of the run times of the sequentially executed queries that constitute the benchmark. This figure compares SingleStore, SQL Server 2017 at scale factor 10,000, and SQL Server 2016 at scale factor 30,000 (10 TB and 30 TB).
Compared to TPC-DS, TPC-H is a much friendlier (and older) benchmark. We ran H at the 10 TB scale factor on a cluster of 8 i3.8xlarge leaf nodes, and then scaled to run it at 30 TB using 24 i3.8xlarge leaf nodes. The 30 TB dataset contains a table with 180 billion rows, compressed to about 11 TB on disk in our columnstore, and took about three and a half hours at an average of 2.4 GB/s to load from S3 using our Pipelines feature.
While researching the benchmark, we found that every run submitted to the TPC at these larger scales was for SQL Server, the best of which we’ve graphed next to our results above. As shown in Figure 4, at a lower scale, we are outperformed by a quad-socket host running SQL Server with 224 vCPUs versus our 256. But at a larger size, scale-out catches up to scale-up – and running on commodity hardware versus specially-crafted quad socket monsters is a virtue of its own, as far as data center operators are concerned. Details of the SQL Server results are given in benchmark results published by Microsoft [MS16, MS17].
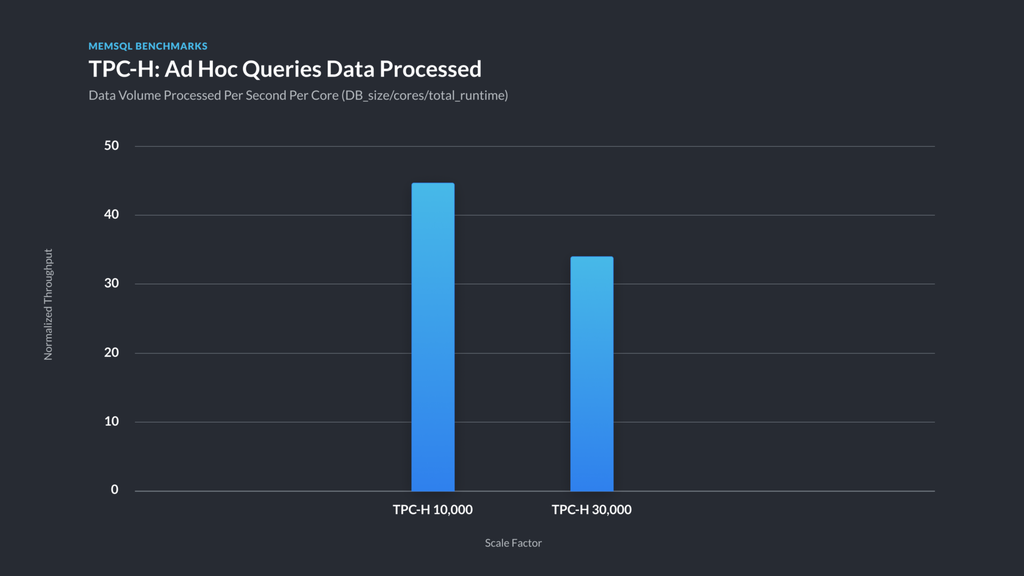
Figure 5 – Data volume processed per second per core for TPC-H . This chart shows a normalized throughput measure (DB_size_MB/cores/sum_of_query_runtimes_in_seconds) for each of TPC-H 10000 and TPC-H 30000. This is to illustrate how SingleStore scales for the benchmark as data size increases.
What we’re most looking for here is validation of our scale-out architecture. A fantasy, “perfectly scalable” database would process 3x the data with 3x the hardware in the same amount of time; as illustrated in Figure 5, we took about 30% longer than that ideal. Given that queries often require a final aggregation step, some falloff is expected. Moreover, more hardware adds substantial marginal return and doesn’t hit a ceiling in these tests — per core throughput drops by 30% as total work done goes up by a factor of around 300%.
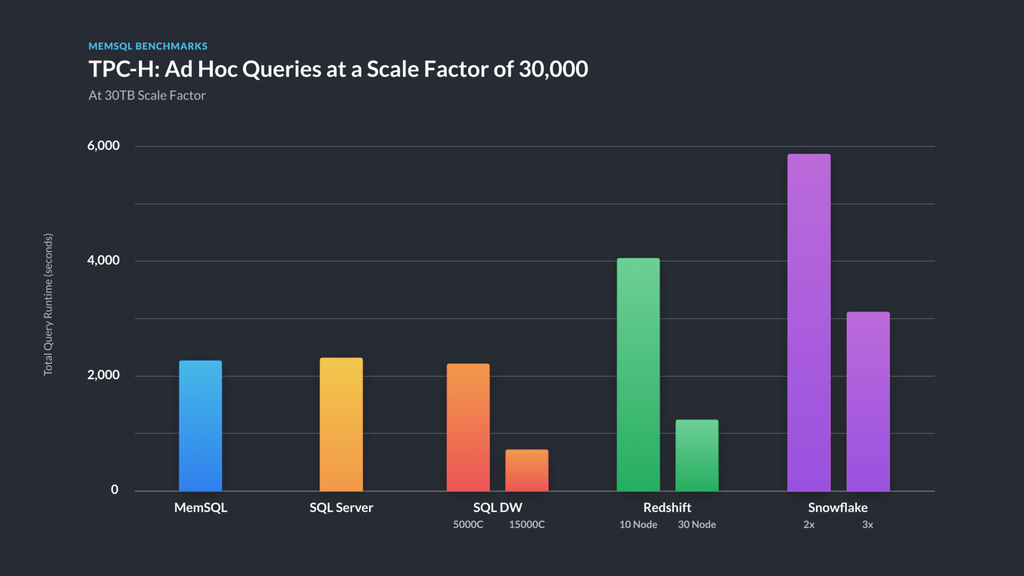
Figure 6 — comparative TPC-H results at 30 TB scale factor.
We again scoured the web for TPC-H results and found several for well-known cloud data warehouse products, including Amazon Redshift, Microsoft Azure SQL Data Warehouse, and Snowflake Data Warehouse in reports from GigaOm [GO18, GO19], as well as certified single-box results on the TPC web site. As shown in Figure 6, SingleStore provides competitive results compared to these products.
Cost and Value
At this point you might think the results are pretty impressive, but you’re probably also thinking there is some special-purpose hardware helping make these benchmarks run smoothly. Well, there isn’t. Just as we didn’t add any code tricks to make the benchmark run better, we didn’t use anything other than industry-standard hardware. We really wanted to make these benchmarks replicable by anyone who wanted to test them, and you can. We explain how to do that below.
The enterprise edition of SingleStore will cost you dramatically less than legacy vendors such as Oracle, plus we have a free version running on up to a 4 node cluster that supports all enterprise features. Beyond just price, we believe SingleStore offers new value to customers by enabling them to build operational analytics applications, mixing OLTP and analytics operations, in a way that has not been feasible before. This enables real-time dashboards and other analytics on just-born data, driving new business value.
By showing results for TPC-C, TPC-H, and TPC-DS running on one scale-out-capable SQL DBMS, we believe we demonstrate that SingleStore delivers new value. In addition, given the breadth SingleStore covers, once a group of application developers in an organization are trained to use it, they can apply their skills to a broad range of applications, giving flexibility to them and their managers. This of course is also valuable to the business.
Conclusion
We’ve shown that SingleStore can deliver strong results for the TPC-H and TPC-DS analytical benchmarks and the TPC-C transaction processing benchmark. To our knowledge, we’re the only SQL DBMS supporting true shared-nothing scale-out that can do this. Our hardware needs are comparable to competitors when running these benchmarks at similar scale factors, and our software licensing costs are significantly less than those of the established database vendors. SingleStore skills can be used to build a variety of applications, including systems for transaction processing, operational analytics, operational data stores, and data warehousing, without scale limits. This will give you and your team the ability to solve multiple problems at once, in less time, with one powerful tool.
This post was edited to remove a comparison to another company’s published data after we discovered that the comparison was technically inaccurate.
Appendix A: More Detailed Results
TPC-C
The hardware configurations we used for TPC-C for 1,000, 10,000, and 50,000 warehouse scale factors are given in the following table. The node types given are for AWS.
| Warehouses | Leaf Nodes | Sum Leaf vCPUs | Sum Leaf RAM | Aggregator Nodes | tpmC |
|---|---|---|---|---|---|
| 1,000 | 3 x r3.4xlarge | 48 | 366 GB | 3 x r3.4xlarge | 94,900 |
| 10,000 | 18 x r3.8xlarge | 1,152 | 4.29 TB | 18 x r3.8xlarge | 800,400 |
| 50,000 | 36 x r5.metal | 3,456 | 27 TB | 21 x r5.metal | 5,300,000 |
We used the open-source MySQL driver from Percona for TPC-C, with slight modifications to the DDL. Specifically, we made the item table into a reference table, the history table into a columnstore table, changed indexes where appropriate to be hashes instead of skiplists, and sized the bucket count appropriately for the size of the dataset. Our cluster was configured to use two replicas for data, replicated synchronously across paired hosts, with asynchronous writes to disk.
Aggregator nodes ran the benchmark driver alongside the SingleStore aggregator instances, where the driver consumed roughly half of the CPU used. Although we used the same instance type for leaves and aggregators out of convenience, in the TPC-C workload aggregators also required very little RAM, and it should be easily possible to save on costs by running on lower-end hosts.
We can’t speak highly enough of the driver from Percona and how useful it was in enabling us to run the benchmark. We generated our datasets using the utility from the same repo, albeit modified to generate pipe-separated value files. We then loaded these files in parallel with SingleStore Pipelines, instead of doing direct database inserts.
TPC-H
The hardware configurations we used on AWS for TPC-H are given in the following table.
| Scale Factor | Leaf Nodes | Sum Leaf Phys. Cores | Sum Leaf RAM | Aggregator Nodes | Power Run (s) |
|---|---|---|---|---|---|
| 10 TB | 8 x i3.8xlarge | 128 | 1.9 TB | 1 x m4.10xlarge | 1,789 |
| 30 TB | 24 x i3.8xlarge | 384 | 5.72 TB | 1 x m4.10xlarge | 2,371 |
We generated our datasets using the open-source dataset generator available from tpc.org. In calculating the power run, we performed a warmup query, then averaged the result of 1-5 executions. The total number of runs was sometimes limited due to the total runtime of all the queries and the time available to finish the runs.
TPC-DS
The hardware configuration we used on AWS for TPC-DS is shown in the table below.
| Scale Factor | Leaf Nodes | Sum Leaf Phys. Cores | Sum Leaf RAM | Aggregator Nodes | Power Run (s) |
|---|---|---|---|---|---|
| 10 TB | 19 x i3.16xlarge | 608 | 9.05 TB | 1 x i3.16xlarge | 6,495 |
We generated our datasets using the dataset generator available from tpc.org. In calculating the power run, we performed a warmup query, then averaged the result of 1-5 executions, depending on the runtime of query execution, in the same fashion as for our TPC-H runs.
Appendix B: How to Play Along at Home
If you’re interested in replicating our results, or experimenting with SingleStore and these benchmarks, we’ve included instructions on how we went about running C, H, and DS here.
TPC-C
To run the TPC-C benchmark, we relied heavily on Percona’s excellent work, which we’ve forked to github.com/memsql/tpcc-mysql. This driver allows both generating the dataset and driving load. As SingleStore is wire compatible with MySQL, we were able to use the driver binary in an effectively unaltered format; in fact, the only changes we made to the repository were as follows:
- Fixed a units bug that caused queries to be judged as failing if they took 5 milliseconds instead of 5 seconds.
- Changed the dataset generator to create pipe-separated value files rather than inserting directly into the database.
- Altered the schema to have shard keys and to take advantage of SingleStore features such as reference tables and hash indices.
If you’d like to use this driver to verify our results, the README covers how to both generate data and run the benchmark.
Cluster Setup
For the purposes of the TPC-C benchmark, there are several configuration settings that will drastically impact your results. To match what we used, do the following:
- SingleStoreDB Self-Managed 7.0: While we did recently make our latest and greatest 6.x release available, one of the major improvements in SingleStoreDB Self-Managed 7.0 (download here) is an entirely new system for handling intra-cluster replication more efficiently. While 6.x releases support replication, performance is dramatically improved in 7.0.
- Enable synchronous replication.
- Enable asynchronous durability.
- Once SingleStore has the correct configuration, you will need to create a database, per the Percona README.
Benchmark Execution
While running the benchmark is exceedingly simple, to fully stress a large SingleStore cluster you will need to spread the load across multiple aggregators. To get relevant results, the driver instances need to run in parallel, and only data from when all drivers are running is a valid representation of the cluster’s performance. We wrote a harness that used the database to coordinate across hosts; however, as it hooks in pretty deeply to our internal benchmarking system, we’re unable to meaningfully open source this extension.
TPC-H & DS
While the TPC-C specification is highly descriptive and gives a wide latitude in how results are achieved, TPC-H and DS are explicitly about executing SQL queries. As such, we were able to leverage the dataset and query generation tools available for free download from tpc.org: [H], [DS].
At a high level, running both benchmarks on SingleStore consists of the following steps:
- Data generation
- Create the table schema using our script (so that you use properly sized SingleStore data types and our shard key definitions and indexes) using
create-tables.sql - Load the data, using SingleStore Pipelines or a tool of your choice
- After loading the data, create statistics and optimize the tables; the commands are found in
after-load.sql - Run the queries by executing
queries.sql
Sizing the SingleStore database cluster
We ran the benchmarks on AWS. For the DS benchmark at the 10 TB size we used a 20 node cluster with 1 MA, and 19 leaves, in total 20 nodes; for the H benchmark at 30 TB we used a cluster with an m4.10xlarge aggregator and 24 i3.8xlarge leaves.
Generating the data
Use the standard data generator for each benchmark found at http://www.tpc.org/tpc_documents_current_versions/current_specifications.asp. To accomplish this, look under H & DS and download the tools for that benchmark. Register, download the latest version, compile the C-based generator. Data generation can take a long time, especially at a larger scale like the 10 & 30TB sizes we used. The data size of the csvs will unexpectedly be quite close to the promised value, and we highly recommend asynchronously compressing and uploading to cloud storage; we stored the generated data files in AWS s3.
Creating the schema
You can find the table schema and queries at the SingleStore github repo at memsql/benchmarks-tpc, looking under the ‘h’ or ‘ds’ subdirectories as appropriate. You can clone or copy them to your local machine by using the command
git clone git@github.com:memsql/benchmarks-tpc.git
In the benchmarks-tpc/tpcds and benchmarks-tpc/tpch directories you can find the files we used to create and run the benchmark, respectively H and DS versions of create-tables.sql, after-load.sql andqueries.sql. Two common ways to submit queries to SingleStore are to use the command line MySQL client or the SingleStore tools. The SingleStore Studio tools, including the SQL editor, are described at https://docs.singlestore.com/db/latest/en/user-and-cluster-administration/cluster-management-with-tools/singlestore-db-studio-overview.html.
Loading the data
Depending on the system your test cluster is running on, there are various alternatives for loading data. The SingleStore Pipelines feature loads data in parallel; see https://archived.docs.singlestore.com/v6.7/concepts/pipelines/pipelines-overview/. We used SingleStore Pipelines to load data from S3 for our tests. An example pipeline command follows.
CREATE PIPELINE catalog_sales AS LOAD DATA S3\"<memsqlpath\>/sf_10000/catalog_sales."\CONFIG '{"region":"us-east-1","disable_gunzip":false} '\CREDENTIALS '{"aws_access_key_id": "<key\>",\"aws_secret_access_key": "<secret\>"} '\INTO TABLE catalog_sales\FIELDS TERMINATED BY '|'\LINES TERMINATED BY '|\n';
After loading
The background flusher in SingleStore automatically and asynchronously reorganizes columnstore segment files (the internal files used to store columnstore tables) for compression and to create a total ordering across all segment files in a table. To make query execution faster and avoid asynchronous processes during query execution, we manually ran the command “optimize table”, as in OPTIMIZE TABLE call_center; see https://archived.docs.singlestore.com/v6.7/reference/sql-reference/data-definition-language-ddl/optimize-table/
SingleStore has manually created histogram statistics. Manual statistics can be created by running “analyze table” on each table, such as: ANALYZE TABLE call_center COLUMNS ALL ENABLE
We did this before running the queries. These two commands are provided in after-load.sql.
Running the queries
We ran the queries multiple times and use the average run time, not counting the initial run where the query was compiled. We used columnstore tables for this benchmark, which are stored on disk, not in memory. The difference between the warm-up run and subsequent runs is just the time to compile a query, which was generally less than a second, but might be as long as a couple of seconds for very large and complex queries. The average run time varies a little on multiple runs of a query in a shared system like AWS, but we never saw that much variation.
Many TPC benchmarks, including TPC-DS, have templatized queries that replace “placeholders” in an incomplete query text with specific values, such as numeric or string constants. We didn’t find much variation with different parameters, so we used a fixed parameterization for the ease of tracking performance across time. We include the query text with the parameters we used when running the queries in queries.sql.
Appendix C: TPC-H Raw Results
As described above, when running TPC-H and TPC-DS, there was an initial “cold” or warm-up run where SingleStore compiles (optimize and code-gen) the queries in addition to running them. (See our documentation for the compilation pipeline.)The warm run reuses that same query plan, but re-executes the entire query re-reading all data. The cold run time is a single run, while the final result is an average of warm runs as reported in Appendix A.
Generally the difference between final and cold times comes down to the compilation time as described above. However, as some results show, there can be other factors coming from the use of shared infrastructure.
| Query | 10T (final) | 10T (cold) | 30T (final) | 30T (cold) |
|---|---|---|---|---|
| 1 | 18.916 | 19.815 | 24.238 | 26.117 |
| 2 | 17.073 | 18.38 | 94.10 | 101.062 |
| 3 | 76.483 | 76.655 | 97.520 | 103.450 |
| 4 | 28.236 | 29.84 | 34.818 | 36.77 |
| 5 | 48.442 | 49.520 | 57.897 | 61.024 |
| 6 | 9.852 | 10.42 | 12.712 | 13.536 |
| 7 | 45.125 | 46.410 | 85.488 | 84.513 |
| 8 | 27.961 | 28.751 | 65.812 | 66.735 |
| 9 | 154.404 | 159.037 | 266.970 | 266.544 |
| 10 | 62.519 | 64.069 | 73.248 | 75.532 |
| 11 | 30.524 | 32.183 | 82.781 | 83.560 |
| 12 | 16.454 | 18.083 | 20.369 | 22.320 |
| 13 | 183.827 | 183.469 | 201.577 | 193.112 |
| 14 | 106.647 | 107.013 | 125.455 | 127.872 |
| 15 | 44.927 | 46.704 | 67.685 | 70.124 |
| 16 | 35.947 | 37.478 | 39.534 | 40.943 |
| 17 | 15.431 | 16.307 | 34.820 | 34.690 |
| 18 | 428.70 | 425.285 | 499.514 | 501.920 |
| 19 | 27.400 | 31.504 | 29.340 | 31.137 |
| 20 | 268.29 | 271.174 | 221.616 | 230.66 |
| 21 | 83.632 | 84.015 | 118.185 | 118.438 |
| 22 | 58.341 | 61.310 | 120.527 | 122.270 |
Appendix D: TPC-DS Raw Results
Refer to Appendix C for information on how to interpret these results.
| Query | 10T (final) | 10T (cold) |
|---|---|---|
| 1 | 7.933 | 9.232 |
| 2 | 16.367 | 17.324 |
| 3 | 0.774 | 1.633 |
| 4 | 105.199 | 106.541 |
| 5 | 23.133 | 27.435 |
| 6 | 149.987 | 150.346 |
| 7 | 2.033 | 3.293 |
| 8 | 2.624 | 3.558 |
| 9 | 9.375 | 17.654 |
| 10 | 8.231 | 11.261 |
| 11 | 46.006 | 45.239 |
| 12 | 0.836 | 3.395 |
| 13 | 2.327 | 4.435 |
| 14 | 321.497 | 329.853 |
| 15 | 7.681 | 5.129 |
| 16 | 60.115 | 58.161 |
| 17 | 2.421 | 6.716 |
| 18 | 10.289 | 13.983 |
| 19 | 2.059 | 4.071 |
| 20 | 0.955 | 3.061 |
| 21 | 1.292 | 2.353 |
| 22 | 1.509 | 3.311 |
| 23 | 590.080 | 598.040 |
| 24 | 1435.269 | 1530.016 |
| 25 | 2.390 | 7.031 |
| 26 | 1.510 | 2.930 |
| 27 | 2.245 | 4.688 |
| 28 | 27.215 | 34.892 |
| 29 | 120.356 | 124.340 |
| 30 | 8.656 | 10.561 |
| 31 | 18.996 | 19.429 |
| 32 | 0.541 | 2.212 |
| 33 | 7.459 | 9.128 |
| 34 | 2.730 | 4.494 |
| 35 | 21.369 | 25.379 |
| 36 | 1.017 | 2.043 |
| 37 | 10.826 | 12.178 |
| 38 | 79.474 | 81.756 |
| 39 | 0.466 | 1.686 |
| 40 | 1.526 | 4.418 |
| 41 | 0.946 | 1.544 |
| 42 | 0.385 | 0.972 |
| 43 | 3.816 | 5.118 |
| 44 | 3.320 | 5.727 |
| 45 | 5.890 | 7.475 |
| 46 | 4.012 | 5.758 |
| 47 | 10.873 | 12.565 |
| 48 | 1.554 | 3.780 |
| 49 | 3.285 | 9.361 |
| 50 | 1.942 | 4.884 |
| 51 | 3.006 | 5.080 |
| 52 | 0.894 | 1.508 |
| 53 | 0.741 | 1.818 |
| 54 | 4.990 | 8.529 |
| 55 | 0.724 | 1.403 |
| 56 | 5.036 | 7.167 |
| 57 | 6.109 | 8.491 |
| 58 | 3.430 | 4.521 |
| 59 | 26.509 | 27.612 |
| 60 | 7.257 | 9.501 |
| 61 | 3.056 | 6.141 |
| 62 | 2.779 | 4.038 |
| 63 | 1.879 | 4.765 |
| 64 | 11.704 | 28.918 |
| 65 | 3.920 | 5.362 |
| 66 | 1.629 | 8.578 |
| 67 | 1382.295 | 1379.958 |
| 68 | 3.045 | 5.198 |
| 69 | 7.111 | 10.689 |
| 70 | 5.992 | 6.805 |
| 71 | 3.560 | 6.693 |
| 72 | 38.113 | 39.607 |
| 73 | 1.799 | 2.840 |
| 74 | 32.279 | 33.930 |
| 75 | 21.565 | 29.151 |
| 76 | 1.550 | 4.514 |
| 77 | 3.917 | 8.667 |
| 78 | 1392.938 | 1431.461 |
| 79 | 18.727 | 21.594 |
| 80 | 6.433 | 13.057 |
| 81 | 9.889 | 11.282 |
| 82 | 28.270 | 29.588 |
| 83 | 4.068 | 5.807 |
| 84 | 1.807 | 3.201 |
| 85 | 2.433 | 5.647 |
| 86 | 0.684 | 1.599 |
| 87 | 63.438 | 64.373 |
| 88 | 24.798 | 27.863 |
| 89 | 0.927 | 1.940 |
| 90 | 0.648 | 2.492 |
| 91 | 1.976 | 3.140 |
| 92 | 0.414 | 2.424 |
| 93 | 0.372 | 1.183 |
| 94 | 32.121 | 35.912 |
| 95 | 152.090 | 152.829 |
| 96 | 0.765 | 1.766 |
| 97 | 8.628 | 9.905 |
| 98 | 1.443 | 3.888 |
| 99 | 6.189 | 7.854 |
References
[AL19] TPC Benchmark DS Full Disclosure Report, Scale Factor 10,000, Alibaba, http://www.tpc.org/results/fdr/tpcds/alibaba~tpcds~alibaba_cloud_e-mapreduce~fdr~2019-03-19~v01.pdf, March 19, 2019.
[AL19b] TPC Benchmark DS Full Disclosure Report, Scale Factor 10,000, Alibaba Cloud AnalyticDB, http://www.tpc.org/results/individual_results/alibaba/alibaba~tpcds~alibaba_cloud_analyticdb~es~2019-04-26~v01.pdf, April 26, 2019.
[DB17] J. Sompolski and R. Xin, Databricks, Benchmarking Big Data SQL Platforms in the Cloud, https://databricks.com/blog/2017/07/12/benchmarking-big-data-sql-platforms-in-the-cloud.html, 2017.
[Cis19] TPC Benchmark DS Full Disclosure Report, Scale Factor 10,000, Cisco, http://www.tpc.org/results/fdr/tpcds/cisco~tpcds~cisco_ucs_integrated_infrastructure_for_big_data_~fdr~2018-03-05~v01.pdf, March 5, 2018.
[Clo17] Apache Impala Leads Traditional Analytic Database, Cloudera, https://blog.cloudera.com/blog/2017/04/apache-impala-leads-traditional-analytic-database/, April 25, 2017.
[GO18] Data Warehouse in the Cloud Benchmark, https://gigaom.com/report/data-warehouse-in-the-cloud-benchmark/, 2018.
[GO19] Data Warehouse Cloud Benchmark, GigaOm, https://gigaom.com/report/data-warehouse-cloud-benchmark/, 2019.
[MS16] SQL Server 30T TPC-H Result, 2016.
[MS17] SQL Server 10T TPC-H Result, http://www.tpc.org/results/individual_results/lenovo/lenovo~tpch~10000~lenovo_thinksystem_sr950~es~2017-07-09~v01.pdf, 2017.


