
In the era of the Internet of Things (IoT), data is generated at an unprecedented rate.
This data has the potential to provide insights that drive business value and innovation — but with the sheer volume of data, it’s essential to identify and act upon any anomalies that may arise in real time.
The Challenges of IoT Data
IoT data is characterized by its high velocity and volume, and detecting rare occurrences that differ significantly from standard behavior in IoT data is crucial. The challenges include issues with real-time data ingestion, high response times, slow queries and the need for a database that is compatible with vector processing and supports SQL. Additionally, there is a need for a single integrated environment for analytics projects.
Introducing SingleStore
SingleStore offers a suite of features to address the challenges present with IoT data. SingleStoreDB is a database that provides high-velocity data ingestion pipelines, fast analytics, hybrid transaction-analytical processing and enhanced vector support.
In our first-ever demothon, we were tasked with building a power demo based around SingleStore 8.1 features to articulate the critical capabilities and business value of any given solution. Our team chose to demonstrate SingleStore’s prowess in real-time anomaly detection for IoT data. Read on to see the features we highlighted, and how our demonstration worked.
High-velocity data ingestion pipelines
SingleStore enables lightning-fast,real-time data ingestion pipelines that efficiently handle high volumes of data streaming into the system. These pipelines capture, process and load data with minimal latency, enabling real-time analytics and decision making.
Hybrid Transaction-Analytical Processing (HTAP)
SingleStore provides robust support for both transactional (OLTP) and analytical (OLAP) workloads within a single database platform. This unified approach allows organizations to handle operational transactions, while concurrently running complex analytical queries.
Enhanced vector support
Vector processing capabilities are leveraged to accelerate data processing and analytics. Vector support results in significant performance gains and improved efficiency for complex analytical workloads.
You can read more about our built-in vector capabilities here.
Live analytics and interactive dashboards
SingleStore empowers users to perform live analytics and create interactive dashboards through a built-in notebook feature. This intuitive interface enables data exploration, ad-hoc analysis and visualization, facilitating real-time insights and data-driven decision making.
The Architecture
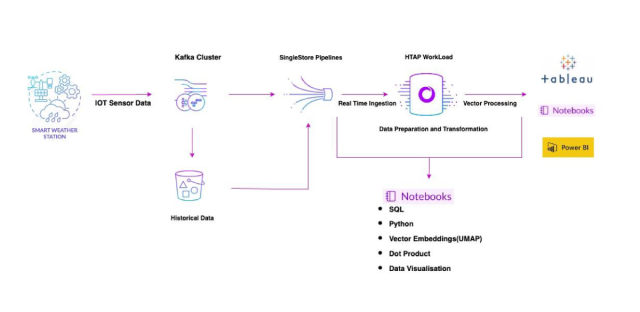
The architecture involves major components including SingleStore Notebooks, source system, Kafka, Python (and its libraries), Pipelines and vector processing. SingleStore Notebooks acts as an integrated environment for analytics, where Python libraries are used for data processing — and SingleStore for data storage and retrieval.
The Demonstration
Our team presented a five-minute demo showcasing real-time data ingestion leveraging SingleStore's Pipeline function. We utilized Python in SingleStore's Notebook environment to generate vector embeddings, leveraging SQL support for vector processing (including the dot_product function).
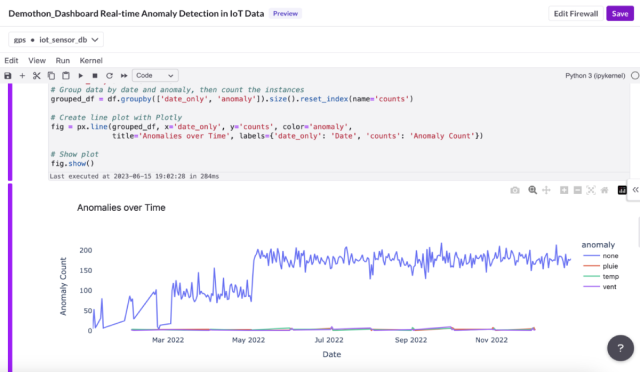
The demo highlighted SingleStore's ability to handle both transactional and analytical queries, and visualized time-series data for effective anomaly monitoring.
1-- Creating a new database named 'iot_sensor_db'2CREATE DATABASE iot_sensor_db;3USE iot_sensor_db;4
5-- Creating a table 'sensor_data_with_vectors' with specified columns6CREATE TABLE sensor_data_with_vectors (7  date DATETIME, -- Date of the sensor reading8  city VARCHAR(50), -- City where the sensor is located9  longitude VARCHAR(50), -- Longitude of the sensor location10  latitude VARCHAR(50), -- Latitude of the sensor location11  vent FLOAT(8,2), -- Wind speed data from the sensor12  pluie FLOAT(8,2), -- Rainfall data from the sensor13  temp FLOAT(8,2), -- Temperature data from the sensor14  anomaly VARCHAR(10), -- Anomaly detection result15  embeddings TEXT -- Vector embeddings of the sensor data16);17
18-- Creating a staging table 'sensor_data_stage' with specified columns19CREATE TABLE sensor_data_stage (20  date DATETIME, -- Date of the sensor reading21  city VARCHAR(50), -- City where the sensor is located22  longitude VARCHAR(50), -- Longitude of the sensor location23  latitude VARCHAR(50), -- Latitude of the sensor location24  vent FLOAT(8,2), -- Wind speed data from the sensor25  pluie FLOAT(8,2), -- Rainfall data from the sensor26  temp FLOAT(8,2), -- Temperature data from the sensor27  embeddings TEXT -- Vector embeddings of the sensor data28);29
30-- Creating a pipeline 'sensor_data_pipeline' to load historical data31from an S3 bucket32CREATE OR REPLACE PIPELINE sensor_data_pipeline AS33LOAD DATA S3 's3://gpsteam/demothon/with_cities_embeddings.csv'34CREDENTIALS '{"aws_access_key_id": "<your_aws_access_key_id>",35"aws_secret_access_key": "<your_aws_secret_access_key>",36"aws_session_token": "<your_aws_session_token>"}'37INTO TABLE `sensor_data_with_vectors`38FIELDS TERMINATED BY ','39ENCLOSED BY '"'40LINES TERMINATED BY '\n'41IGNORE 1 LINES;42
43-- Starting the 'sensor_data_pipeline'44START PIPELINE sensor_data_pipeline;45
46-- Creating a pipeline 'sensor_data_kafka_pipeline' to load real-time47data from a Kafka topic48CREATE OR REPLACE PIPELINE sensor_data_kafka_pipeline49AS LOAD DATA KAFKA  '<your_kafka_broker>:9094/<your_topic_name>'50CONFIG '{51   "security.protocol" : "SASL_SSL",52   "sasl.mechanism" : "SCRAM-SHA-256",53   "sasl.username" : "<your_username>",54   "ssl.ca.location" :55"/etc/pki/ca-trust/extracted/pem/tls-ca-bundle.pem"}'56CREDENTIALS '{57   "sasl.password" : "your_password"}'58INTO TABLE sensor_data_stage59FORMAT JSON (60date <- %::date,61city <- %::city,62longitude <- %::longitude,63latitude <- %::latitude,64vent <- %::vent,65pluie <- %::pluie,66temp <- %::temp,67embeddings <- %::embeddings68);69
70-- Starting the 'sensor_data_kafka_pipeline'71START PIPELINE sensor_data_kafka_pipeline;72
73# Python code for data preparation and generating vector embeddings74
75# Importing necessary libraries76import sqlalchemy77from sqlalchemy import create_engine78import json79import pandas as pd80import umap81from sklearn.preprocessing import normalize82
83# Create a connection to the database84engine = create_engine(connection_url)85
86# Query the database to get the data from 'sensor_data_stage' table87df = pd.read_sql('select * from sensor_data_stage where date', engine)88
89# Fill some null values using backward fill method90df = df.bfill(axis=0)91
92# Remove rows with null values93df = df.dropna()94
95# Install umap-learn library for generating vector embeddings96!pip install umap-learn97
98# Import necessary libraries99import umap100from sklearn.preprocessing import normalize101
102# Select the features for generating embeddings103features = new_df1[['vent', 'pluie', 'temp']]104
105# Create a UMAP reducer with 15 components106reducer = umap.UMAP(n_components=15)107
108# Fit the reducer to the features and transform the features109embeddings = reducer.fit_transform(features)110
111# Normalize the embeddings112normalized_embeddings = normalize(embeddings, norm='l2')113
114# Add the embeddings to the dataframe115new_df1['embeddings'] = list(normalized_embeddings)116
117# Iterate over each row in the new DataFrame118for index, row in new_df.iterrows():119    # Get the embeddings from the current row120    embeddings = row['embeddings']121
122    # Convert numpy array to list and then to a JSON string123    embeddings_json = json.loads(embeddings)124
125    # Create the query string   126    query = f"""127           SELECT anomaly, COUNT(anomaly) as count128            FROM (129                SELECT anomaly, dot_product(130                    JSON_ARRAY_PACK('{embeddings_json}'),131                    JSON_ARRAY_PACK(sensor_data_with_vectors.embeddings)132                ) AS similarity133                FROM sensor_data_with_vectors134                ORDER BY similarity DESC135                LIMIT 20136            ) AS subquery137            GROUP BY anomaly138            ORDER BY count DESC;139    """140
141    # Execute the query142    result = pd.read_sql_query(query, con=engine)143
144    # Check if the result is empty145    if not result.empty:146        # Append the result to the current row in the new DataFrame147        new_df.loc[index, 'anomaly'] = result['anomaly'].values[0]148    else:149        # Set anomaly to None or some default value150        new_df.loc[index, 'anomaly'] = 'none'151
152# Convert the data types of the columns in the new DataFrame153new_df['date'] = pd.to_datetime(new_df['date'])154new_df['city'] = new_df['city'].astype(str)155new_df['longitude'] = new_df['longitude'].astype(str)156new_df['latitude'] = new_df['latitude'].astype(str)157new_df['vent'] = new_df['vent'].astype(float)158new_df['pluie'] = new_df['pluie'].astype(float)159new_df['temp'] = new_df['temp'].astype(float)160new_df['anomaly'] = new_df['anomaly'].astype(str)161new_df['embeddings'] = new_df['embeddings'].astype(str)162
163# Append the new DataFrame to the 'sensor_data_with_vectors' table in164the database165new_df.to_sql('sensor_data_with_vectors', con=engine,166if_exists='append', index=False)167Displaying real-time data in graph:168
169import pandas as pd170from sqlalchemy import create_engine171import plotly.express as px172engine = create_engine(connection_url)173df = pd.read_sql('select * from sensor_data_with_vectors limit 50000;',174engine)175df['date'] = pd.to_datetime(df['date'])176df['date_only'] = df['date'].dt.date177# Group data by date and anomaly, then count the instances178grouped_df = df.groupby(['date_only',179'anomaly']).size().reset_index(name='counts')180
181# Create line plot with Plotly182fig = px.line(grouped_df, x='date_only', y='counts', color='anomaly',183              title='Anomalies over Time', labels={'date_only': 'Date',184'counts': 'Anomaly Count'})185
186# Show plot187fig.show()
Business Benefits
Implementing real-time anomaly detection in IoT data has several benefits:
- Early anomaly detection. Quickly identify and address anomalies to prevent cascading failures, and optimize performance.
- Better route optimization. For logistics and transportation, real-time data can help optimize routes.
- Risk mitigation strategies. Early detection of anomalies allows businesses to develop strategies to mitigate risks.
- Optimized maintenance schedules. Predictive maintenance can be performed by analyzing the data trends.
- Reduced latency. Faster data processing and reduced response times.
- Single integrated environment. A single environment for both transactional and analytical data processing simplifies operations.
Conclusion
Real-time anomaly detection in IoT data is imperative for businesses looking to leverage the full potential of IoT. SingleStoreDB offers a powerful set of features that helps organizations achieve this. With high-velocity data ingestion pipelines, enhanced vector support and HTAP capabilities, SingleStore is well equipped to handle the challenges posed by IoT data.
Thank you for reading! Check out these additional resources — and stay tuned for more blogs from our demothon teams.
Additional resources:
.png?height=187&disable=upscale&auto=webp)
.png?width=24&disable=upscale&auto=webp)


.png?height=187&disable=upscale&auto=webp)