

In this blog post, we’ll show how we used cypress-terminal-report to facilitate debugging test failures by fetching all the Cypress Logs.
For developing the frontend of our product (Customer Portal), we use Cypress as the primary testing framework. We have two types of Cypress tests: end-to-end and component tests.
We have relatively few end-to-end tests, yet these test all layers of the product — including the SingleStoreDB database engine, backend and frontend. Since some of these tests create database clusters, they can take some time to finish. Thus, the Cypress Component Tests (CCT) are the main tests for every facet of our product’s interface.
However, these tests come with a caveat: they can be very flaky if not written properly. Our CI/CD job for CCT fails most frequently due to flaky tests. The only artifacts our pipeline collects to inspect the failed tests are the screenshots and videos that Cypress creates, which are not always enough to easily assess what happened to the failed test. For this reason, we tried to find a way to get the Cypress logs for each test, including the console logs printed while the tests are run (which are not visible in the Cypress videos).
At the moment, Cypress doesn’t support this kind of logging by default. In an open issue on Cypress’s GitHub, someone provided a list of current workarounds for this problem. Of all the plugins mentioned, we decided to go with `cypress-terminal-report`.
cypress-terminal-report
This npm package is still in active development, collecting all the necessary logs for a very simple debugging of Cypress tests. Before we go on, let’s see how we set up this plugin.
How to setup cypress-terminal-report
First, we need to install the plugin:
npm i --save-dev cypress-terminal-report
Afterward, we need to import two things:
The collector needs to be imported in the support file for Cypress tests. Since we want to use the plugin for both e2e and CCT, we’ll add the import in file cypress/support/logging.ts:
import installLogsCollector from "cypress-terminal-report/src/installLogsCollector";
installLogsCollector({});
And then both support files, cypress/support/e2e.ts and cypress/support/component.ts, should import logging.ts.
As for the printer, it needs to be imported in `cypress.config.ts`:
import { defineConfig } from "cypress";
import installLogsPrinter from "cypress-terminal-report/src/installLogsPrinter";
export default defineConfig({
e2e: {
setupNodeEvents(on, config) {
installLogsPrinter(on, {});
},
},
component:
setupNodeEvents(on, config) {
installLogsPrinter(on, {});
},
},
});
With this basic setup, the plugin will capture Cypress command logs and network requests, and output them to the terminal when a test fails. It will also capture console logs, but only for e2e tests (not for CCT). These tests run in a different iframe, so the plugin cannot redirect the logs directly to the terminal. However, it is very important to us to get the CCT console logs, since these are usually flakier. We were able to accomplish this with a workaround.
How to get console logs for Cypress Component tests
First, we replace the window.console functions with our custom one, which will use Cypress's internal logging function — Cypress.log. We do this for every component test, so we write this inside the before hook. To prevent the extra logging when running Cypress in headed mode (“isInteractive”), we add the code inside an if condition. The function processArg will stringify the objects to be readable.
before(() => {
if (!Cypress.config("isInteractive")) {
const consoleFuncs = ["log", "error", "info", "warn"];
cy.window().then((win) =>
consoleFuncs.forEach((method) =>
// @ts-ignore
win.console[method] = (...args: Array => {
Cypress.log({
name: `${method}-1`,
message: args
.map((arg) => processArg(arg))
.join(",\n"),
});
};
});
});
}
});
With this block of code, the plugin will output the logs with the following format:
cy:command log-1 console log output
cy:command error-1 console error output
cy:command info-1 console log output
cy:command warn-1 console warn output
This could be enough, but we want to correctly specify the types of logs, not just cy:command, just like the plugin does for end-to-end tests.
One of the config options available in installLogsCollector is processLog which we can set to a custom function to process the logs the way we want. The function accepts a list of three arguments: [type, message, severity]. It then returns the same type of list, after the necessary processing. Here, we check for the cy:command type of logs, and if the message matches the regex expression for any of the console functions, we substitute the type of log with the new one (cons:log, cons:error, …) and the message without the first part (log-1, error-1, …).
import installLogsCollector, {
LogType,
} from "cypress-terminal-report/src/installLogsCollector";
const CONSOLE_FUNCS_LOG_TYPES_MAP: Record<string, LogType> = {
log: "cons:log",
error: "cons:error",
info: "cons:info",
warn: "cons:warn",
};
installLogsCollector({
processLog: (args) => {
const [argType, message, severity] = args;
let newArgType = argType;
let newMessage = message;
if (newArgType === "cy:command") {
for (const [func, logType] of Object.entries(
CONSOLE_FUNCS_LOG_TYPES_MAP
)) {
const regex = new RegExp(`${func}-1\t(.+)`, "s");
const match = newMessage.match(regex);
if (match) {
newArgType = logType;
newMessage = match[1];
}
}
}
return [newArgType, newMessage, severity];
},
});
Now, the output will have the following format:
cons:log console log output
cons:error console error output
cons:info console log output
cons:warn console warn output
With these new changes, we can get all the output for each Cypress test in the terminal.
Now, there’s another catch: we have several logs for each test, and with the increase of lines, the terminal won’t go back far enough to show all the logs for one test. So, the best way to analyze the logs will be if they are collected in a file.
How to print logs to files
The plugin already has the option to write the logs to a file. We can define a single file to output the logs to, which will be overwritten each time we run a new test. Or, we can write to a file for each spec test, using the name of the test as the name of the log file. However, we were having an issue with the naming of the files for CCT, where they would be something like https:localhost:XXXX/..../cypress_runner.js, which was not very useful.
To circumvent this issue, we chose to create and write the log files with our own code. With the printer option function `collectTestLogs`, we can, as the name suggests, collect the test logs for the current test and save them in a variable.
// cypress.config.ts
import { defineConfig } from "cypress";
import installLogsPrinter from "cypress-terminal-report/src/installLogsPrinter";
let testLogs = "";
const logsPrinterConfig: installLogsPrinter.PluginOptions = {
collectTestLogs: (testInfo, logs) => {
// testInfo.state: "passed" | "failed"
const statusSymbol = testInfo.state === "passed" ? "(+)" : "(-)";
let testContent = `${statusSymbol} ${testInfo.test}\n`;
logs.forEach((logType, message, severity]) => {
testContent += `\t\t<$logType} (${severity}):\n`;
testContent += `${message
.split("\n")
.map((line) => `\t\t\t\t${line}`)
.join("\n")}\n`;
});
testLogs += testContent;
},
};
export default defineConfig({
e2e: {
setupNodeEvents(on, config) {
installLogsPrinter(on, logsPrinterConfig);
},
},
component: {
setupNodeEvents(on, config) {
installLogsPrinter(on, logsPrinterConfig);
},
},
});
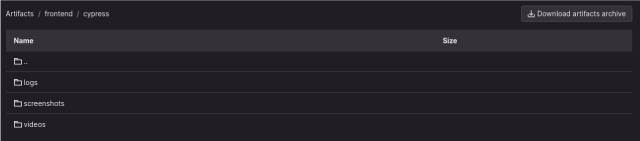
With these changes, when the tests run in headless mode we will have a new folder logs next to the folders videos and screenshots created by Cypress. On the definition for the e2e and CCT jobs on GitLab, we can add:
artifacts:</span>
when: always
paths:
- frontend/cypress/screenshots
- frontend/cypress/videos
- frontend/cypress/logs
And all the artifacts will be available for us to look through when trying to debug a test failure.
Here is an example of a passed and failed test. The logs have been reduced to only show a couple of the outputted logs.
(+) Example Component - Feature A -> verify success case
cy:command (success):
new url http://localhost:8004/
cons:log (success):
Dispatching:,
{
"type": "QUERY_INITIAL_DATA",
}
cy:command (success):
mount <Unknown ... />
cons:log (success):
Request:,
{
...
}
cons:log (success):
Handler:,
{
...
}
cons:log (success):
Response:,
{
...
}
cons:error (success):
Missing field '...' while writing result {
"...": true
}
cy:command (success):
findByLabelText Choose a connection
cy:command (success):
select conn1
cy:command (success):
findByRole option, {name: conn1, selected: true}
cy:command (success):
findByRole option, {name: conn1_db1, selected: true}
cy:command (success):
findByRole option, {name: conn1_db2, selected: false}
cy:command (success):
assert expected **2** to equal **2**
(-) Example Component - Feature A -> verify error case
cy:command (success):
new url http://localhost:8004/
cy:command (success):
mount <Unknown ... />
cy:command (success):
findByLabelText Choose a connection
cy:command (success):
select conn3
cy:command (success):
findByRole option, {name: conn3, selected: true}
cy:command (error):
contains Failed to fetch data.
Stats:
suites: 1, tests: 2, passes: 1, failures: 1, skipped: 0
Errors:
AssertionError: Timed out retrying after 15000ms: Expected to find content: 'Failed to fetch
data.' but never did.
at Context.<anonymous> (webpack://customer-portal/./src/test.spec.tsx:228:11)
at runnable.fn (http://localhost:8004/__cypress/runner/cypress_runner.js:156580:19)
at callFn (http://localhost:8004/__cypress/runner/cypress_runner.js:107972:21)
at <unknown> (http://localhost:8004/__cypress/runner/cypress_runner.js:164209:30)
at PassThroughHandlerContext.finallyHandler
(http://localhost:8004/__cypress/runner/cypress_runner.js:7881:23)
at PassThroughHandlerContext.tryCatcher
(http://localhost:8004/__cypress/runner/cypress_runner.js:11327:23)
at Promise._settlePromiseFromHandler
(http://localhost:8004/__cypress/runner/cypress_runner.js:9262:31)
Just looking at the logs, we can see what happened to the test, before watching the video. We can see that the first test passed, because it has the plus (+) sign before the name. However, the second test failed since it has the minus (-) sign. This test failed in the assertion cy.contains while checking for the string “Failed to fetch data.” since it’s the only command with the state (error).
At the end of the logs, we have the general stats for this test suite and the error stack for the error. The first line of the error is usually shown in the video, but not the error stack.
Conclusion
When dealing with a flaky Cypress test, it can be hard to understand the problem by only looking at the videos and screenshots. The test could be redirecting to the wrong page, the stored session id could be invalid leading to a 404 page, etc. There could be a number of issues with your app that will make a Cypress test occasionally fail, but wouldn’t be easily assessed by looking only at the UI.
This is where the logging comes in. Having the ability to view and investigate the logging of a test can make it much easier to fix test flakiness. In our CCT tests, we mock all of the GraphQL queries and mutations with MSW. A missing mock could create test flakiness, and the logging will show the name of the missing query/mutation.
With the steps outlined on this blog post, we were able to have a workaround to show the Cypress command logs and the console logs for each test. We think this would be a great addition to Cypress’s default configuration. It would make debugging tests that much easier!
Resources

.png?width=24&disable=upscale&auto=webp)


