I love notebooks as I can easily emulate my code, visualize its output and collaborate with my colleagues.
Today, I want to show you a quick Python Jupyter notebook tutorial on how to connect to SingleStoreDB from your local notebook. I also give you some code snippets on how to write into and read from SingleStoreDB. I will finish with a quick visualization code snippet using Plotly.
To dive deeper into SingleStore Notebooks, check out this blog on our launch. Looking for even more technical detail? Head over to our Notebooks documentation.
Intro
Here are a few things to know before starting:
- I am using a csv file from the gapminder data that you can download here.
- I would recommend using Visual Studio Code or Anaconda.
- I uploaded the notebook that can be downloaded here.
You should be familiar with working with a local notebook environment, installing Python library and of course using SingleStoreDB (try it for free).
Get the Right Libraries
The first cell in my notebook is to import the libraries in your notebook environment. If you don’t have these libraries installed, you can go on on pypi.org to install each library on your local machine (Pymysql, pandas, Plotly and SQLalchemy).
1import pymysql2import pandas as pd3from pandas.io import sql4from sqlalchemy import Column, VARCHAR5from sqlalchemy.ext.declarative import declarative_base6from sqlalchemy import create_engine7import sqlalchemy8import pandas as pd9import plotly.express as px
Connect to a SingleStoreDB Database
My second cell is to set the variables for my connection:
1# I set the username, password and database name as variables2UserName='Your user name'3Password='Your Password'4DatabaseName='Your database'5URL='Your URL'
Where Can You Find the URL?
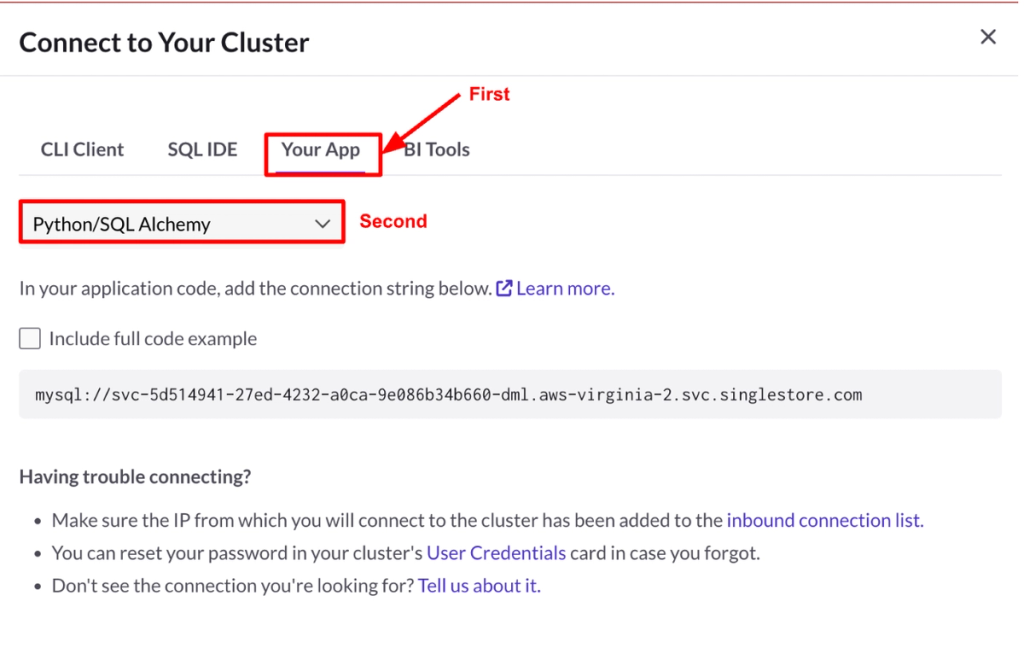
The URL you need to enter will look like the following:
svc-df0gt59a-af3a-4ty5-9ff2-13b8h81c155-dml.aws-oregon-2.svc.singlestore.com
If you have a workspace, you can access the connection string by clicking on your workspace, and then the Connect button:
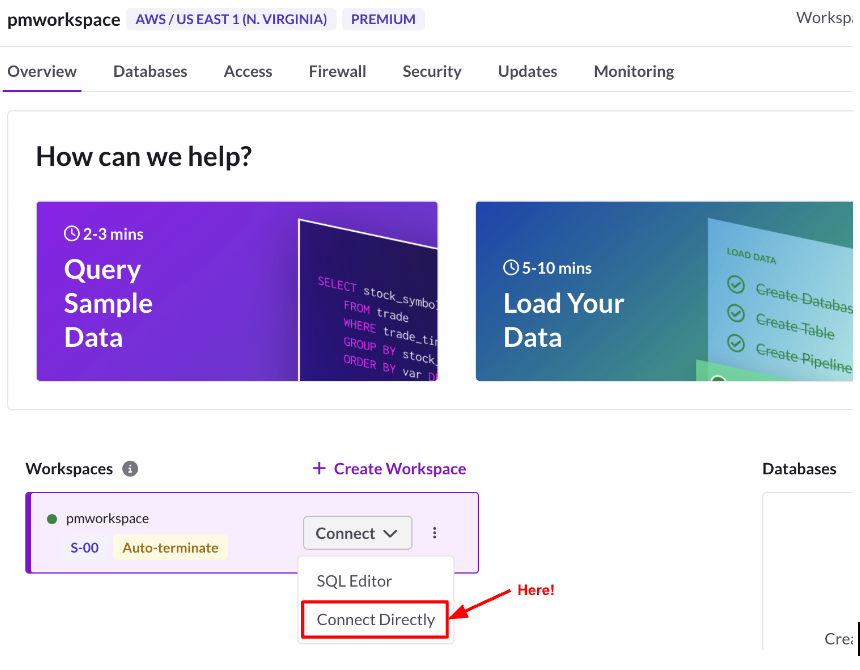
The next step is to find the connection string URL:
The third cell in my notebook is to set the connection to the database:
1# Creating the database connection2db_connection_str = "mysql+pymysql://"+UserName+ ":" +Password3+"@"+URL+"/"+ DatabaseName4db_connection = create_engine(db_connection_str)
Insert a Dataframe Into a Newly Created Table
If you want to follow the tutorial, you can download the csv file on your local machine in the same folder as your notebook.
First, you need to load the csv file into a dataframe (fourth cell):
1df_data = pd.read_csv("gapminder_tidy.csv")2df_data
Second, you can load that dataframe into an existing or new table (it will create the table in SingleStoreDB):
1# Insert whole DataFrame into MySQL2df_data.to_sql('gapmindertidy', con = db_connection, if_exists = 'append', 3index = False, chunksize = 1000, dtype ={'country': sqlalchemy.types.NVARCHAR(length=255),4 'continent': sqlalchemy.types.NVARCHAR(length=255),5 'year': sqlalchemy.types.INTEGER(),6 'metric': sqlalchemy.types.NVARCHAR(length=255),7 'value': sqlalchemy.types.Float(precision=3, asdecimal=True)} )
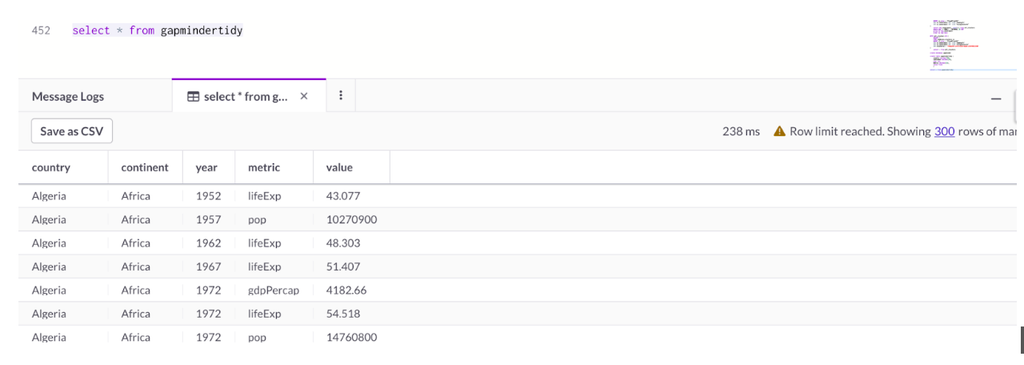
If you switch to SingleStoreDB portal, you should see the following result for a “Select * from gapmindertidy” command:
Read a Table from SingleStoreDB
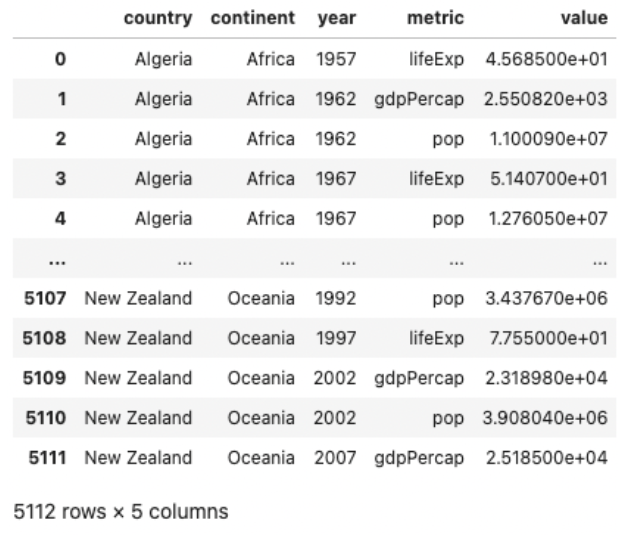
Now, you can read the table you just created with the following command:
1DataFromDB = pd.read_sql('SELECT * FROM gapmindertidy', con=db_connection)2DataFromDB
You should see the following result:
Visualize Data Using Plotly
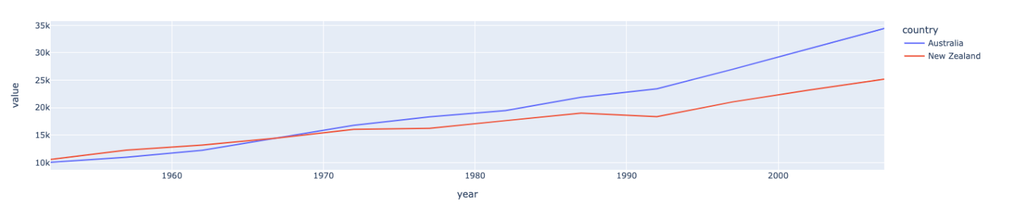
Here is a code snippet to do some visualization on this table:
1df_gdp_oceania = DataFromDB.query("continent=='Oceania' &2metric=='gdpPercap'").sort_values(['country','year'],ascending = [True,3True])4fig = px.line(df_gdp_oceania, x = "year", y = "value", color = "country")5fig.show()
That code snippet should show the following graph once executed:
Voila, you are all set to do more serious things with SingleStoreDB using Python and notebooks!
Stay tuned on our developer experience announcements in the future by following us on Twitter @SingleStoreDevs.