SingleStore Notebooks
New


Sales Data Analysis Dataset From Amazon S3
Notebook
Note
This notebook can be run on a Free Starter Workspace. To create a Free Starter Workspace navigate to Start using the left nav. You can also use your existing Standard or Premium workspace with this Notebook.
Note
This notebook creates a pipeline, data may take up to 1 minute to populate
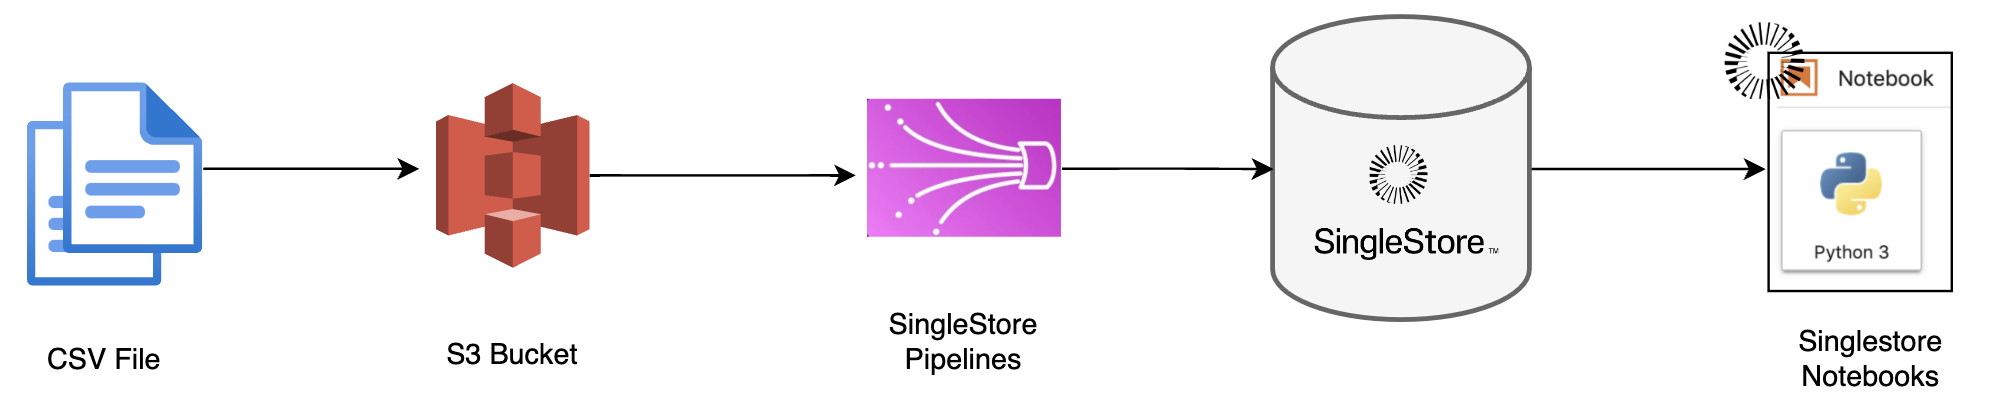
The Sales Data Analysis use case demonstrates how to leverage SingleStore's powerful querying capabilities in a business intelligence context like analyzing sales data stored in a CSV file.
This demo showcases typical operations that businesses perform to gain insights from their sales data, such as:
calculating total sales
identifying top-selling products
analyzing sales trends over time.
By working through this example, new users will:
learn how to load CSV data into Singlestore from S3
execute aggregate functions
perform time-series analysis
Demo Flow
How to use this notebook
Create a database (You can skip this Step if you are using Free Starter Tier)
We need to create a database to work with in the following examples.
In [1]:
1shared_tier_check = %sql show variables like 'is_shared_tier'2if not shared_tier_check or shared_tier_check[0][1] == 'OFF':3 %sql DROP DATABASE IF EXISTS SalesAnalysis;4 %sql CREATE DATABASE SalesAnalysis;
Create Table
In [2]:
1%%sql2
3CREATE TABLE IF NOT EXISTS SalesData /* Creating table for sample data. */ (4  `Date` text CHARACTER SET utf8mb4 COLLATE utf8mb4_general_ci,5  `Store_ID` bigint(20) DEFAULT NULL,6  `ProductID` text CHARACTER SET utf8mb4 COLLATE utf8mb4_general_ci,7  `Product_Name` text CHARACTER SET utf8mb4 COLLATE utf8mb4_general_ci,8  `Product_Category` text CHARACTER SET utf8mb4 COLLATE utf8mb4_general_ci,9  `Quantity_Sold` bigint(20) DEFAULT NULL,10  `Price` float DEFAULT NULL,11  `Total_Sales` float DEFAULT NULL12)
Load Data Using Pipelines
In [3]:
1%%sql2CREATE PIPELINE IF NOT EXISTS SalesData_Pipeline AS /* Creating pipeline for sample data. */3LOAD DATA S3 's3://singlestoreloaddata/SalesData/*.csv'4CONFIG '{ \"region\": \"ap-south-1\" }'5/*6CREDENTIALS '{"aws_access_key_id": "<access key id>",7               "aws_secret_access_key": "<access_secret_key>"}'8               */9INTO TABLE SalesData10FIELDS TERMINATED BY ','11LINES TERMINATED BY '\n'12IGNORE 1 lines;13
14
15START PIPELINE SalesData_Pipeline;
Data may take couple of seconds to load after pipeline is started, rerun cell to verify
In [4]:
1%%sql2SELECT count(*) FROM SalesData
Sample Queries
We will try to execute some Analytical Queries
Top-Selling Products
In [5]:
1%%sql2SELECT product_name, SUM(quantity_sold) AS total_quantity_sold FROM SalesData3 GROUP BY product_name ORDER BY total_quantity_sold DESC LIMIT 5;
Sales Trends Over Time
In [6]:
1%%sql2SELECT date, SUM(total_sales) AS total_sales FROM SalesData3GROUP BY date ORDER BY total_sales desc limit 5;
Total Sales by Store
In [7]:
1%%sql2SELECT Store_ID, SUM(total_sales) AS total_sales FROM SalesData3GROUP BY Store_ID ORDER BY total_sales DESC limit 5;
Sales Contribution by Product (Percentage)
In [8]:
1%%sql2SELECT product_name, SUM(total_sales) * 100.0 / (SELECT SUM(total_sales) FROM SalesData) AS sales_percentage FROM SalesData3 GROUP BY product_name ORDER BY sales_percentage DESC limit 5;
Top Days with Highest Sale
In [9]:
1%%sql2SELECT date, SUM(total_sales) AS total_sales FROM SalesData3 GROUP BY date ORDER BY total_sales DESC LIMIT 5;
Conclusion
We have shown how to insert data from a Amazon S3 using Pipelines to SingleStoreDB. These techniques should enable you to
integrate your Amazon S3 with SingleStoreDB.
Clean up
Remove the '#' to uncomment and execute the queries below to clean up the pipeline and table created.
Drop Pipeline
In [10]:
1%%sql2
3#STOP PIPELINE SalesData_Pipeline;4
5#DROP PIPELINE SalesData_Pipeline;
Drop Data
In [11]:
1#shared_tier_check = %sql show variables like 'is_shared_tier'2#if not shared_tier_check or shared_tier_check[0][1] == 'OFF':3# %sql DROP DATABASE IF EXISTS SalesAnalysis;4#else:5# %sql DROP TABLE SalesData;
Details
About this Template
The Sales Data Analysis use case demonstrates how to utilize SingleStore's powerful querying capabilities to analyze sales data stored in a CSV file.
This Notebook can be run in Shared Tier, Standard and Enterprise deployments.
Tags
starterloaddatas3
See Notebook in action
Launch this notebook in SingleStore and start executing queries instantly.
License
This Notebook has been released under the Apache 2.0 open source license.