
At SingleStore, we want to create the ultimate database — a single, unified single database that powers all our customers’ needs.
Part of that is world class performance across a variety of demanding workloads, and we’ve already got it. However, performance is not enough without ease of use — and a key part of that is monitoring.
That’s why, as part of our Winter 2022 release, we’ve introduced three new monitoring features in Singlestore Helios:
- Real-time utilization metrics
- Storage breakdown by database
- Historical monitoring
Real-Time Utilization Metrics
Our customers need a real-time view of the three most important types of fuel that power SingleStoreDB: CPU, memory and cache. Of course, these are broken down across Workspaces, which is how SingleStoreDB achieves separation of storage and compute.
This gives customers a real-time snapshot of the health of their deployment and whether they might need to scale up, or have the ability to scale down. Real-time analytics is one of our greatest strengths and most popular use cases, so it’s no surprise we have it baked into our product.

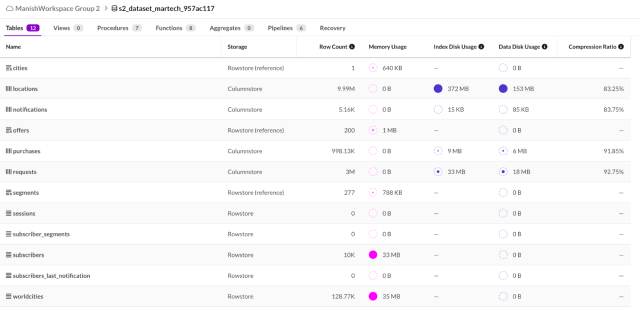
The preceding view is focused on Workspaces, but database breakdowns are also necessary. That’s why we show how much memory and disk space each database uses, as well as the amount of the latter that is taken up by indexes. Our innovative UI also makes it super easy to see which database is taking up the most space at a glance, which is a common need when customers are trying to optimize their space usage.
Historical Monitoring
At this point you may be thinking, “It’s great that I can easily see what’s happening right now, but what about what’s happened in the past?” Customers need to see how their system responded to demand surges in the past to effectively plan for the future.
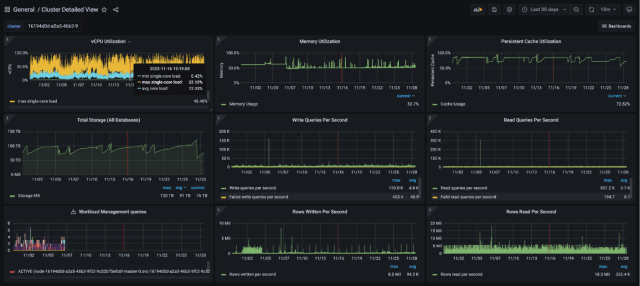
Fortunately, we’ve got you covered there too — with a zero setup, free, 100% functional out-of-the-box integration with Grafana. One click and you get the following view, which shows you:
- A fine-grained, time-series view of CPU, memory and cache utilization
- Queries and rows written and read per second
- How many queries are failing, and more
This gives you a comprehensive view into historical system performance, and aids in future planning.
The best part? This is just the beginning of our monitoring journey. We’ve go plenty more great improvements in the pipeline, so stay tuned!
Want to see more from SingleStoreDB 8.0? Check out our webinar, “What’s New in the Winter Release and What’s in the Roadmap?” where we dive deeper into the latest innovations and features.
And if you’re ready to get started and see for yourself, you can try SingleStoreDB free.


-for-Real-World-Machine-Learning_feature.png?height=187&disable=upscale&auto=webp)

