
SingleStore offers a powerful tool called Visual Profile that is highly beneficial for performance tuning.
If you have a query running slower than expected, you can collect a visual profile of the query. It provides details like execution time, row counts and memory usage of different steps in the query plan. This allows you to identify bottlenecks in your system, making schema or query changes to improve performance. With this tool, it's also possible to determine which query plans are more likely to be resource intensive, which is helpful if you anticipate high demand from your application and expect increased resource usage during a specific time window.
SingleStore is a multi-model, multi-cloud, scalable, distributed SQL database for both transactions and real-time analytics. Customers like Hulu, Armis and Comcast trust SingleStore to accelerate their time-to-insights while decreasing the size, complexity and cost of their data architecture.
SingleStore unifies transactions and analytics in a single engine to drive low-latency access to large datasets, simplifying the development of fast, modern enterprise applications. Built for developers and architects, SingleStore is based on a distributed SQL architecture, delivering millisecond performance on complex queries — all while ensuring your business can effortlessly scale.
SingleStore helps customers modernize their data stack, delivering real-time analytics, enabling generative AI and minimizing database complexity — enabling use cases like operational analytics, AI/ML, IoT, fraud detection, customer 360, dashboard acceleration and many more.
Using Visual Profile in SingleStore for performance tuning
Visual Profile is a powerful tool in SingleStore for query tuning. First, let’s look at different ways profiles can be collected for a given query.
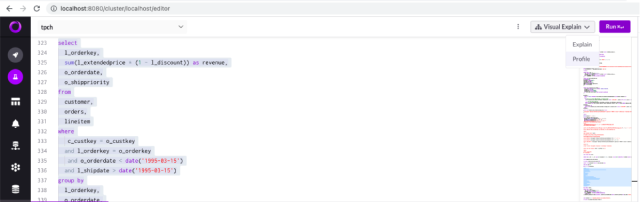
In the SingleStore portal: Highlight the query you want to profile in the SQL Editor, then click the Visual Explain icon next to the Run button. In the drop-down menu, choose PROFILE.
.png?width=1024&disable=upscale&auto=webp)
In SingleStore Studio: Highlight the query you want to profile in the SQL Editor, then click the Visual Explain icon next to the Run button. In the drop-down menu, choose PROFILE.
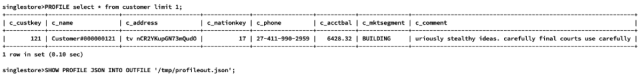
You can also manually collect profiles through the command line by using the word PROFILE before your actual query text. Then, use the SHOW PROFILE command to show the actual profile output., which can be produced in either text or JSON format. I recommend using JSON format whenever possible because it collects more information about operations and can be used directly with Visual Profile.
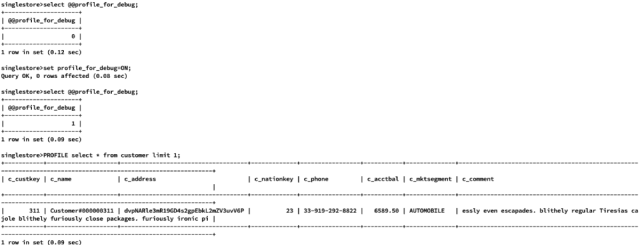
To get more debug information in the JSON profile output, you can set a variable profile_for_debug = ON.
This additional debug includes information like DDL for all objects in the query, global variables settings, table statistics and autostats. This is extremely helpful while debugging complex performance issues — which you should always do whenever possible.
In the SingleStore portal or Studio, you can upload your previously collected JSON profile.
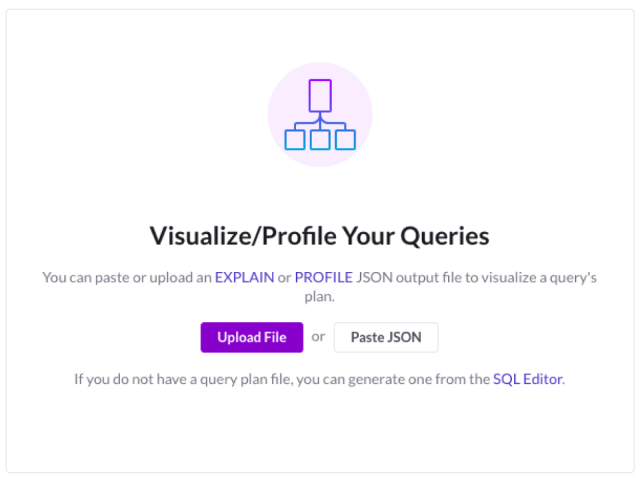
You can also use a standalone URL, https://explain.labs.singlestore.com/, to load these profiles for analyzing these profiles.
These commands will create a visual representation of your query's execution plan, which can help you better understand how your query is being processed and identify potential performance issues.
Each element of the visual representation includes the query plan operation being performed, the percent of total query execution time for each operation and the number of rows processed by each operation. This information identifies any bottlenecks in your query and takes steps to resolve them — which might include making changes to your schema or to the query itself.
The following is an example of a visual profile when it’s opened in the portal or Studio.
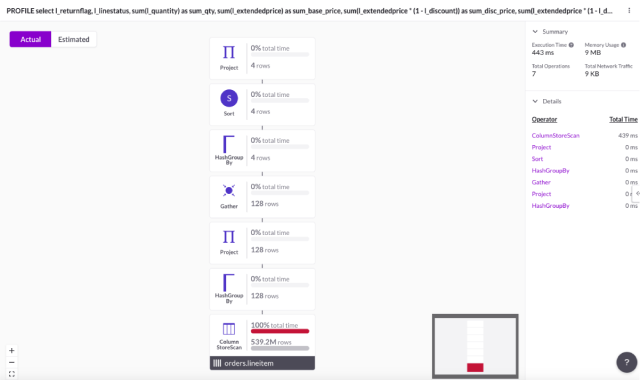
On the right side, it shows a summary of total execution time, memory and network usage. It also lists all the operations in the query ordered by their descending elapsed time.
For easy reading, the visual profile will automatically highlight the most expensive steps in red. In this example, you can see almost 100% of the time is spent on the ColumnStoreScan operation.
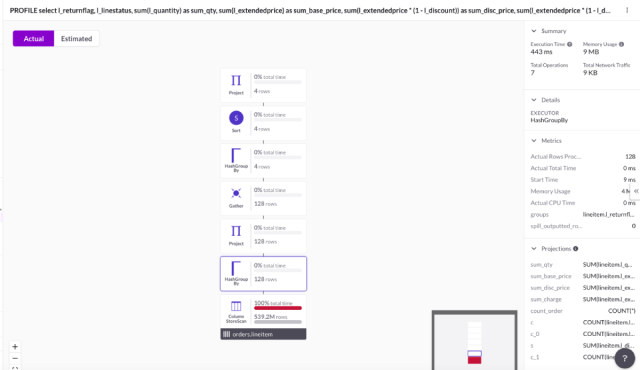
You can click on any operation to get related statistics — the following screenshot shows more details after I clicked on the HashGroupBy operator. On the right side, it shows more information about this operator including projects, group by columns, memory usage, total time, rows processed, etc.
Different query plan operators seen in the visual operator are documented in our docs.
Visual Profile provides an easy to use UI to identify and troubleshoot query performance issues. You can use this tool to identify expensive operations in a query, and help you to tune the query.
If you’re new to SingleStore, try it free today!