
Analyzing query plans is an important part of database optimization. At SingleStore, we continuously improve our Visual Explain UI to make it easier to use for developers looking to optimize their query performance. Tito Griné interned at SingleStore in the Summer of 2021 and did some refactoring of our Visual Explain feature.
What is Visual Explain
Visual Explain is a tool that displays graphically, and in a friendly way, the output of EXPLAIN and PROFILE commands. The result helps database engineers understand queries, discover bottlenecks, and analyze database schemas. They can then use the result insights to optimize query shape and its overall performance. You can see more details about Visual Explain and its implementation in a previous blog post we've published here.
Why refactor Visual Explain
Firstly, this tool was only present in SingleStore Studio, but currently, you can find it in Singlestore Helios as well. Increasing the number of people that use this tool was one of the reasons that led us to refactor Visual Explain, aiming to achieve a better user experience and a better tool. There were some issues with the first implementation, mainly about the user experience. The movement was not very fluid, especially when the graph trees were quite big. We also only supported 3 zoom levels that could only be changed using the +/- buttons, which meant the user had little flexibility when exploring the graph, making the tool cumbersome to use. When comparing with similar tools out there, it was obvious we could be offering something better.
Lastly, it’s important to remember that we are implementing a database management platform. Having logic in our codebase for zooming, panning, or drawing edges doesn’t make sense, since it’s not our main focus. By outsourcing this to a third-party library, we simplify our code and shift the responsibility of having to maintain these functionalities in the future.
We thought that this could be a perfect internship project, so I took on this project shortly after starting my internship. I mainly worked with Marta and Bernardo during my internship. However, I also got to work with members of our Product Design and Query Optimization team on the user experience and interactions of the Visual Explain feature. The weekly UI/UX meetings were also a great avenue to gather feedback from the whole team.
How we approached the Visual Explain refactor
One of the first library suggestions was React Flow. We made some investigations about some other libraries that could also be a solution to improve Visual Explain. We found D3, Victory, and a couple more, but none seemed as good for our use case as React Flow. On top of being made for node graphs as we have on Visual Explain, React Flow is updated often and has a lot of contributors - definitely some metrics worth checking when searching for an open-source library to use.
React Flow is customizable, fast rendering and it also has some helper functions and components such as controls and a minimap, which was one of our most requested features.
To be sure this was really the path we wanted for Visual Explain, we started by doing a small proof of concept. The first goal was to read the generated layout tree and position nodes in a React Flow viewport. React Flow receives the information about all the elements through an array of objects representing either nodes or edges. Here’s an example of a node object:
{
      id: ‘1’,
      type: ‘step’,
      data: {
           label: ‘node’,
      },
      position: {
           x: 50,
           y: 50,
      },
      style: {
          width: 100,
          height: 50,
      },
}
Fig.2 - Example of a React Flow node object
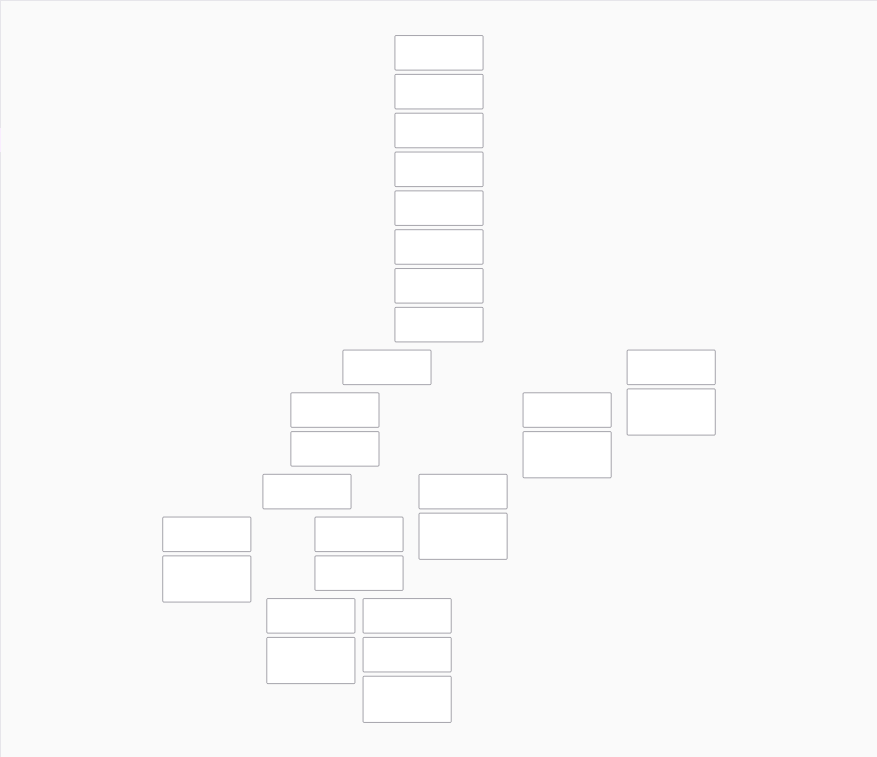
Since we already calculated all nodes’ positions and dimensions, having the nodes displayed using React Flow just required creating an array of these objects with the correct position and width/height values. At this point, our viewport is displaying something like this:
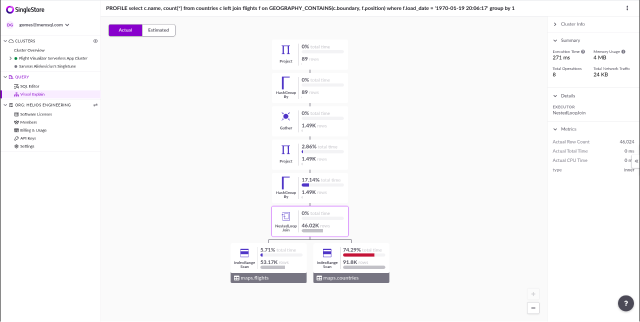
The next step was to actually display the information we wanted on these nodes. Because of how React Flow works, this was surprisingly easy. All that was necessary was to create a custom node type pointing to our previous implementation of the node component. This component also had to be changed, so instead of getting its information through the previous props, it gets it from the data prop. React Flow uses it to pass data to custom elements, and it’s set in each object in the elements array.
With this, our Visual Explain was already looking very similar to our previous implementation:
Finally, to finish the prototype, we had to add the edges to the graph. Edges are added together with the nodes in the elements array but they have a different format. Here’s an example of how an edge object looks like:
{
     id: ‘1-2’,
     type: ‘step’,
     source: ‘1’,
     target: ‘2’,
}
Fig.5 - Example of a React Flow edge object
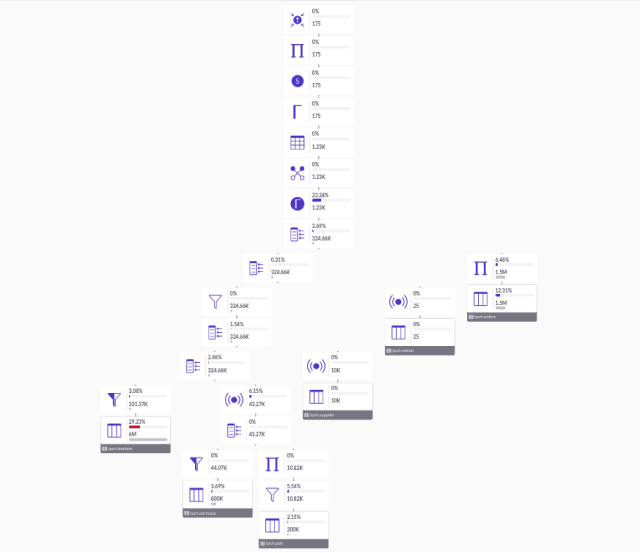
This part required a bit more work. Previously, we were calculating the edge positions and types together with the layout without ever keeping track of the source and target node. This just meant that our layout generation had to, now, append to each node, a list of its childrens' ids. Once we added that, together with a few changes to our custom node component to support handles, it was just a matter of creating the edge objects and adding them to the elements array. In the end, our proof of concept was looking like this:
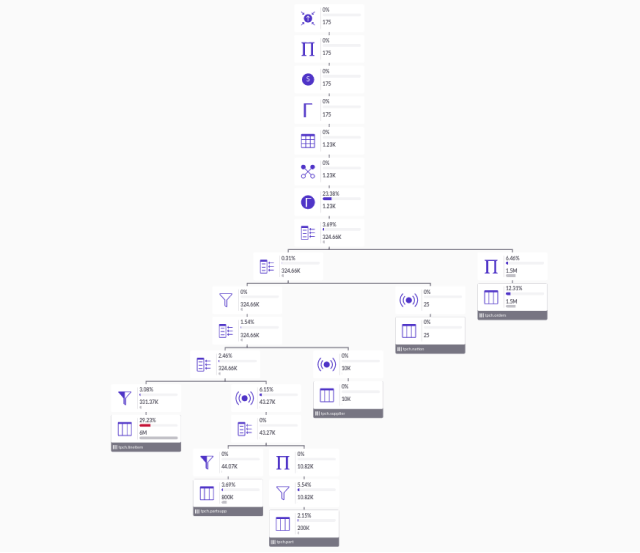
With this prototype, we already knew that our main issues could be resolved with React Flow. We could remove all logic regarding zooming and panning and the layout generation no longer had to calculate edges’ segments and their positions.
After this, we decided to move forward with the refactor using React Flow. We started by removing the unnecessary code and simplifying our remaining logic, mainly the layout generation. After this, we just worked on making sure all existing features were added and working with React Flow, such as:
- Clicking on a node updates the side panel information
- Clicking on an operator in the side panel centers the viewport on the node corresponding to that operation
- Toggling between the actual and estimated row count of each operator
- Have +/- zoom control buttons
- Changing the node styling depending on the current zoom - as the zoom increases, more information is displayed in the nodes
There were also a few other improvements, such as:
- Setting pan and zoom bounds
- Creating a custom edge component (that adjusts its thickness to improve legibility according to the current zoom)
- Using React memo to prevent unnecessary re-renderings
- Other performance improvements such as only rendering nodes on the screen.
Lastly, we took advantage of some built-in features from React Flow and added a fit-to-view button and a minimap to aid in the graph navigation.
The most challenging decisions
Although we believe we chose the right library, there were some challenges. React Flow is made to support a wide variety of interactions ranging from selecting nodes, dragging them around, adding and deleting edges between nodes to other kinds of interactive actions. This results in React Flow making some simplifications and assumptions when dealing with mouse events.
An example of how this is felt is when using click and drag panning. If a user tries to pan by clicking inside a node and then dragging, even if the node isn’t draggable, React Flow won’t interpret that event as panning. This can make the user experience a bit awkward, especially on Visual Explain where the only interaction we have with nodes is clicking on them. Consequently, the user might be expecting that a click and drag will result in panning no matter where in the viewport, as this is how it worked in our previous implementation.
The only way to implement this behavior with React Flow would be to disable all element interactions with the mouse events (either clicking, scrolling, or hover). Obviously, this raises an issue in our case, since we want the user to be able to click in a node, updating the side panel with information regarding that operation.
To work around this, we'd have to reimplement a lot of React Flow's core logic for element clicking. Since we believe most users will try to pan on the empty space, we don't think that maintaining this extra logic will be worth it.
One important aspect to keep in mind about React Flow is the fact that it is DOM-based (as was our previous implementation of Visual Explain). Because of this, although it handles graphs with hundreds of nodes with no problems, things can become a problem when we start to have thousands of nodes. In our case, since our graphs aren’t really dynamic, as in, the nodes and connections are immutable, and we were careful in taking advantage of React memo to avoid unnecessary re-renders, React Flow is still quite performant even on large queries with thousands of operations and therefore thousands of nodes. That being said, we can’t be certain that future requirements for Visual Explain won’t make our current implementation poorly performant, at which point we may want to look into libraries that use canvas or WebGL instead. However, since React Flow is still an ongoing project with regular updates and contributions from the community, we can expect some mechanisms to be implemented, aiming to improve its performance. We also look forward to working on some of these improvements ourselves.
One of these is only rendering the nodes and edges that are currently visible on the viewport (or outside the viewport, but very close to it) This can be done by passing in the onlyRenderVisibleElements prop. When exploring this optimization, we found that the maintainer advised against using it, since it actually could make the performance worse. This is because, by only rendering the visible elements, when a node or edge became visible, it had to be re-initialized. However, when testing it on Visual Explain, we found that on large graphs, it was actually improving the performance, but with small to medium sized graphs the performance did worsen. This finding makes sense, since as the number of elements grows, having them all be rendered becomes increasingly expensive. So there is a point in which the performance loss in having to render all the nodes outweighs the performance hit from having to re-initialize the newly visible elements. We made a sensible decision as to what this threshold should be for us.
Final thoughts
Overall, we achieved a better user experience while we reduced the amount of code we need to maintain, so we are happy about it. We want to continue to improve Visual Explain as we believe it’s an essential tool for our users. Keep an eye on it and send us feedback through our Forums!

.png?width=24&disable=upscale&auto=webp)


