
Database systems are becoming more and more specialized, with many applications relying on an increasingly complex web of products that are great at running challenging workloads in a particular domain — but are not capable of addressing general-purpose data needs. In contrast, we believe it is possible to design a database that can satisfy a breadth of requirements for transactional and analytical workloads, with world-class performance across both OLTP and OLAP workloads. That database is SingleStoreDB.
SingleStoreDB runs demanding production workloads for some of the world's largest financial, telecom, high-tech and energy companies. These customers use SingleStoreDB to run a breadth of workloads across their organizations, often replacing two or three different databases with SingleStoreDB.
Our results derived from both TPC-H and TPC-C — industry standard OLAP and OLTP benchmarks — demonstrate that SingleStoreDB achieves state-of-the-art performance. SingleStoreDB can perform as well as specialized operational databases and data warehouses. We ran both benchmarks on SingleStoreDB's Universal Storage, and the results demonstrate SingleStoreDB's unification of world-class transactional and analytical performance in the same database and the same tables.
Benchmark results
We used benchmarks derived from the industry-standard TPC-H and TPC-C to evaluate SingleStoreDB compared to other leading cloud databases and data warehouses. The results show how SingleStoreDB achieves leading-edge performance on both OLAP and OLTP benchmarks.
We run these as a way to demonstrate leading performance on industry-standard benchmarks that are well-understood and easy to compare. As discussed in our previous blog post, we believe that these benchmarks do not show the full breadth of capabilities customers may demand for their modern workloads. But, they're still one of the best standardized ways that the industry currently has to compare performance across database systems. And with the elimination of the DeWitt Clause from our contract, SingleStore is committed to making these benchmark results completely available and transparent.
We compared SingleStoreDB with three other popular, state-of-the-art products: two cloud data warehouses we’ll refer to as CDW1 and CDW2, and a cloud operational database we’ll refer to as CDB. Let's start with a summary of the results derived from both TPC-H and TPC-C:
| TPC-H median runtime (sec) | TPC-H geomean cost (cents) | TPC-C throughput (tpmC) at 1k warehouses | TPC-C throughput (tpmC) at 10k warehouses | |
|---|---|---|---|---|
| SingleStoreDB | 22.83 | 90.23 | 12,545 | 123,346 |
| CDW1 | 26.03 | 91.75 | Not supported | Not supported |
| CDW2 | 24.10 | 91.85 | Not supported | Not supported |
| CDB | Did not finish within 24 hours | Did not finish within 24 hours | 12,582 | Not tested |
Summary of results derived from TPC-H and TPC-C benchmark standards. TPC-H: 10TB scale factor, cold runtimes, lower is better. TPC-C: higher is better, up to the limit of 12.86 tpmC/warehouse
As the results show, SingleStoreDB had excellent performance and cost-performance on analytics compared to the cloud data warehouses, and on transactions compared to CDB. The main point of this comparison is to demonstrate that SingleStoreDB delivers state-of-the-art performance on both analytical and transactional workloads, while CDW1, CDW2 and CDB can only run well on either benchmark, not both. CDW1 and CDW2 only support data warehousing and cannot run TPC-C workloads. CDB can run both benchmarks, but it performs orders of magnitude worse than the cloud data warehouses on TPC-H. Additionally, CDB offers limited scalability on OLTP workloads — previous results show its performance does not scale well to much larger numbers of warehouses.
This chart summarizes the performance on both TPC-C and TPC-H. On this chart, we show the throughput for TPC-C (tpmC, as defined by TPC-C) and the queries per dollar for TPC-H (calculated as 100/geomean query cost in cents). The higher the number, the better.

How we tested
We ran both benchmarks on SingleStoreDB's Universal Storage. That is, both benchmarks were run using the same unified table storage, which is the default out-of-the-box configuration (we did not force rowstore vs. columnstore table storage). This is noteworthy because our results show that SingleStoreDB's Universal Storage is able to deliver state-of-the-art performance on both OLTP and OLAP workloads.
We used indexes, sort keys and shard keys appropriate for each benchmark, and used similar ones across all products where those options were available. We've included setup instructions, schemas, data loading commands and queries for SingleStoreDB at our Github repository.
Our benchmark runs used the schema, data and queries from TPC. However, they do not meet all the criteria for official TPC benchmark runs, and are not official TPC results.
We ran the benchmarks in January 2022 on the latest software versions and hardware instance types available from each database vendor — for SingleStoreDB, this was version 7.6.7.
TPC-H Results
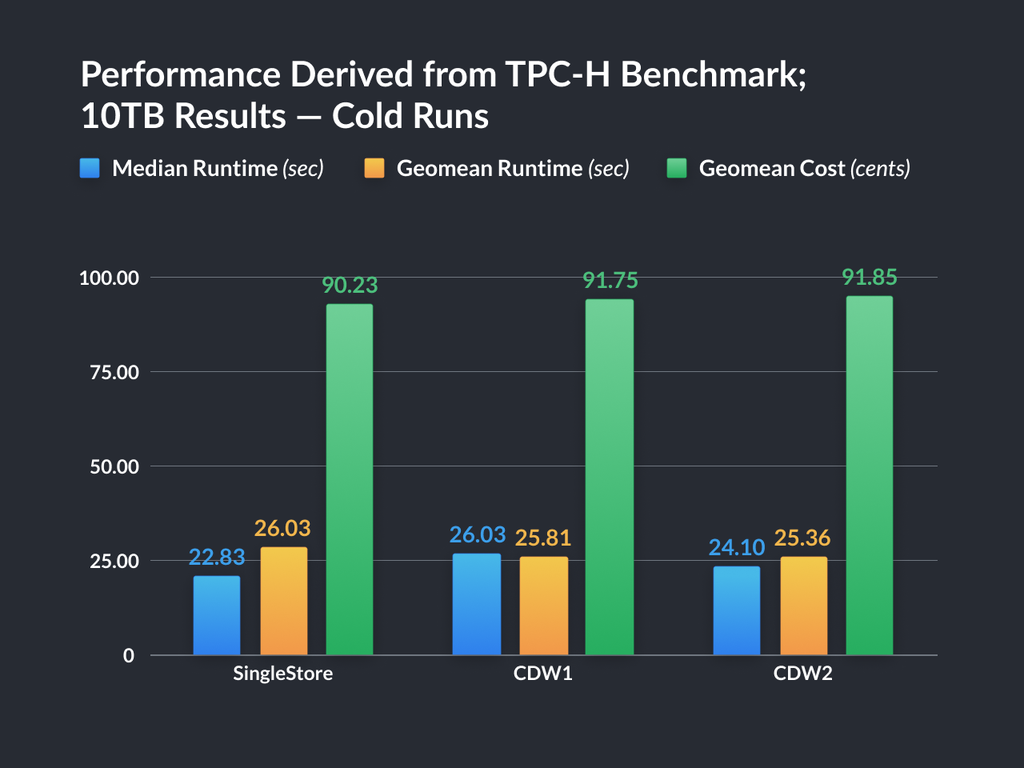
We measured the performance of SingleStore DB compared to two popular, state-of-the-art data warehouses, CDW1 and CDW2 on TPC-H, an industry-standard OLAP benchmark at the 10TB scale factor.
We ran comparisons on public cloud instances with cluster sizes that were chosen to be as similar in price as possible. The costs of the cluster configurations we used are shown in the appendix.
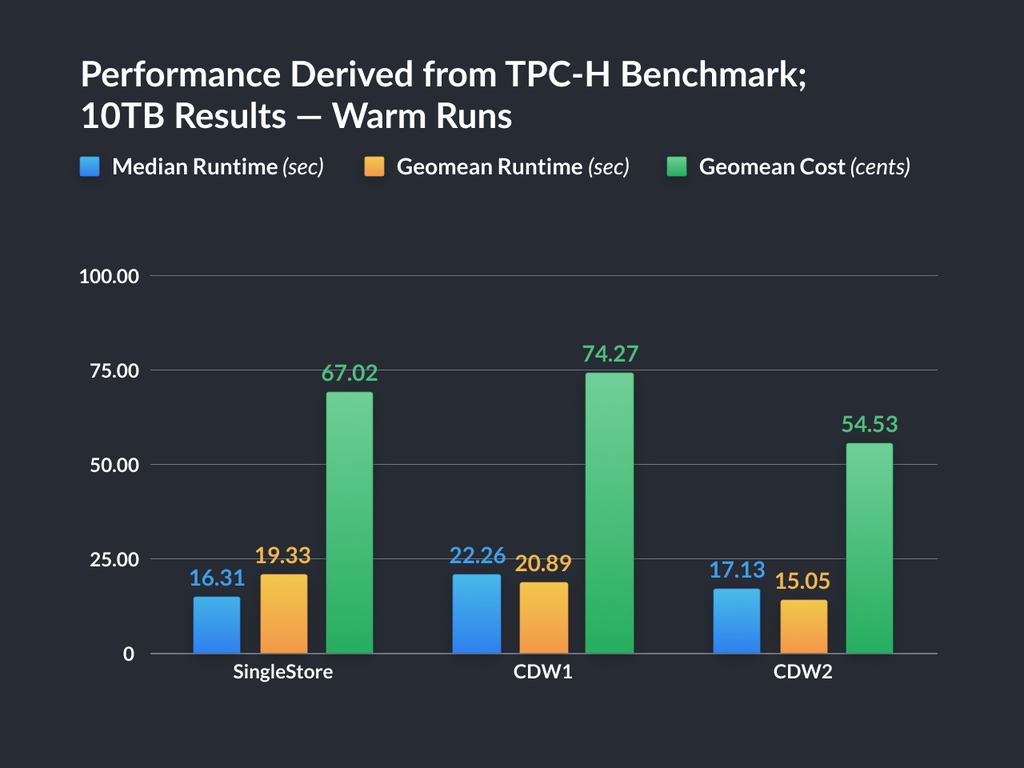
We measured the runtime of one cold run of each query, and then measured the average runtime of three warm runs of each query, with results caching disabled. The warm run allows for query compilation and data caching.
We computed the cost of each query by multiplying the runtime by the price per second of the product configuration. We then computed the geomean of the runtime and cost results across all the queries.
When we tested the operational database CDB on the largest available size, it performed orders of magnitude worse: most queries failed to complete within 1 hour, and a single run of all the benchmark queries failed to complete within 24 hours (compared to about 15 minutes for SingleStoreDB, CDW1 and CDW2).
The results shown in the following chart demonstrate that SingleStoreDB achieves competitive performance on the TPC-H benchmark compared to both leading-edge, specialized cloud data warehouses. A breakdown of results by query can be found in the appendix.
TPC-C Results
We compared SingleStoreDB against CDB, a popular, state-of-the-art cloud operational database, on TPC-C, an industry-standard OLTP benchmark. All SingleStoreDB results were on our columnar-based Universal Storage, and were competitive with CDB which is a rowstore-based operational database. We ran comparisons on public cloud instances with cluster sizes that were chosen to match in vCPU count.
Note that the cloud data warehouses CDW1 and CDW2 do not support running the TPC-C benchmark. As an example, unique constraints are one feature that are not supported in the data warehouses but are supported in SingleStoreDB (they are supported in all table types, including in our Universal Storage). CDW1 and CDW2 only support informational, unenforced unique constraints — their systems cannot enforce the integrity of the constraint, they only use it as an informational hint to the query planner.
We measured the throughput (tpmC), as defined by the TPC-C benchmark. We compared against results previously published by CDB. Note that TPC-C specifies a maximum possible tpmC of 12.86 per warehouse, and both SingleStoreDB and CDB are essentially reaching this maximum at a data size of 1,000 warehouses.
We also tested SingleStoreDB performance on TPC-C at a data size of 10,000 warehouses, and SingleStoreDB delivers excellent scale-out performance — performance on larger TPC-C sizes scales linearly as we scale out the SingleStoreDB cluster size. On the other hand, CDB offers limited scalability on OLTP workloads — previous results show its performance does not scale well to much larger numbers of warehouses.
| Product | Data size (warehouses) | Cluster size (leaf vCPUs) | Throughput (tpmC) | Throughput (% of max) |
|---|---|---|---|---|
| CDB | 1,000 | 32 | 12,582 | 97.84% |
| SingleStoreDB | 1,000 | 32 | 12,545 | 97.55% |
| SingleStoreDB | 10,000 | 256 | 123,346 | 95.91% |
TPC-C benchmark performance (higher is better, up to the limit of 12.86 tpmC/warehouse)
Conclusion
Here's the summary of performance derived from both TPC-C and TPC-H results again:

These results demonstrate that SingleStoreDB achieves state-of-the-art performance competitive with leading operational databases, as well as analytical databases on benchmarks specific to each workload. SingleStoreDB can meet workload requirements that previously required using multiple specialized database systems.
Ready to see these results for yourself? Get started with your free SingleStoreDB trial today. If you're interested in running and experimenting with these benchmarks on SingleStoreDB yourself, we've included setup instructions, schemas, data loading commands and queries at our Github repository.
Appendix — Breakdown of TPC-H Results
See the preceding section for the details of what results we measured.
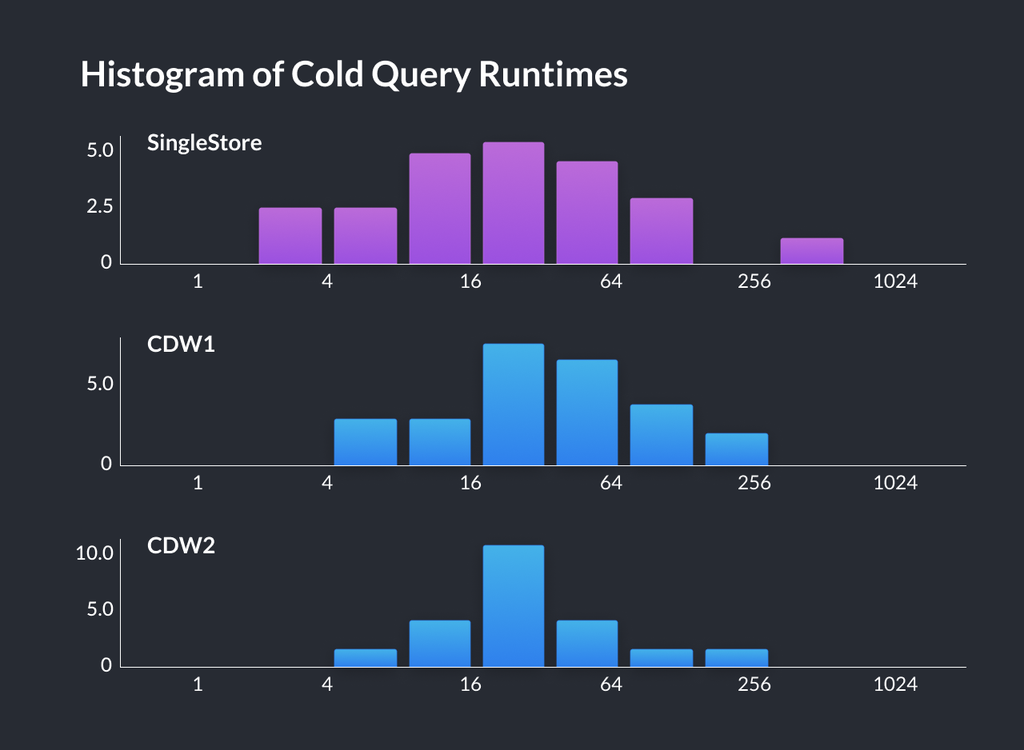
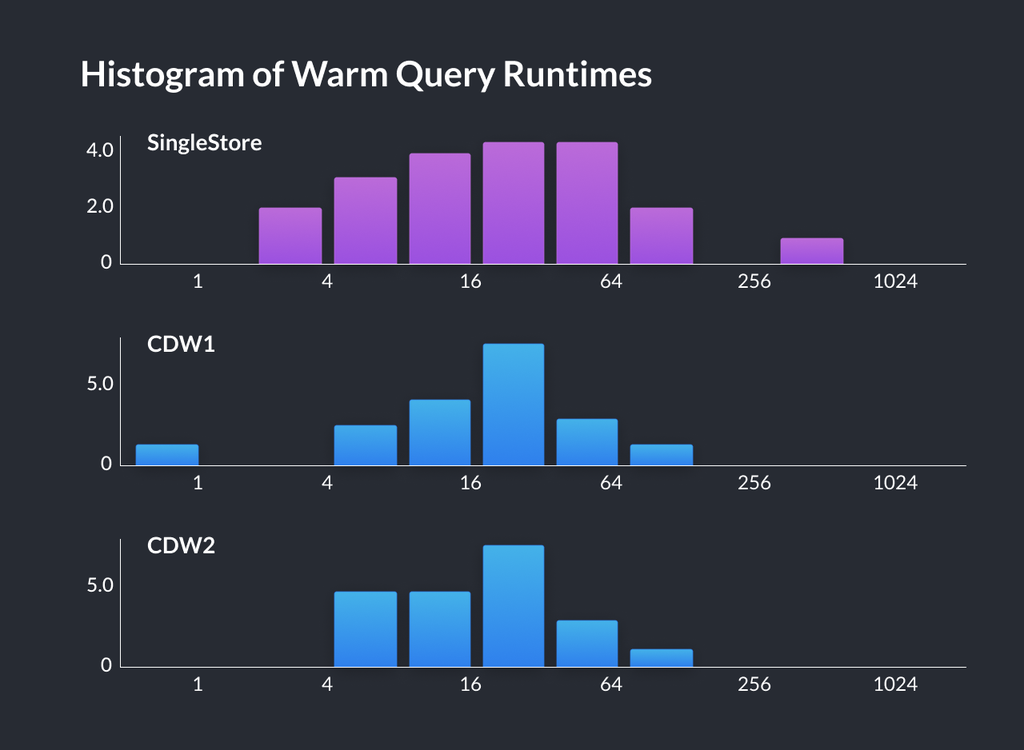
Details of runtimes by query (runtimes are in seconds):
| Cold runs | Cold runs | Cold runs | Warm runs | Warm runs | Warm runs | |
|---|---|---|---|---|---|---|
| SingleStoreDB | CDW1 | CDW2 | SingleStoreDB | CDW1 | CDW2 | |
| Geomean runtime (sec) | 26.03 | 25.81 | 25.36 | 19.33 | 20.89 | 15.05 |
| Median runtime (sec) | 22.83 | 26.03 | 24.10 | 16.31 | 22.26 | 17.13 |
| Cluster price per hour | \$124.80 | \$128.00 | \$130.40 | \$124.80 | \$128.00 | \$130.40 |
| Geomean costs (cents) | 90.23 | 91.75 | 91.85 | 67.02 | 74.27 | 54.53 |
| q1 | 27.41 | 19.55 | 21.44 | 6.41 | 21.24 | 17.98 |
| q2 | 9.46 | 27.18 | 14.27 | 8.40 | 22.80 | 4.25 |
| q3 | 52.70 | 37.34 | 29.12 | 43.25 | 29.34 | 21.74 |
| q4 | 14.52 | 21.18 | 34.58 | 12.32 | 21.71 | 25.25 |
| q5 | 38.57 | 33.73 | 29.48 | 25.95 | 29.55 | 24.32 |
| q6 | 3.50 | 5.74 | 8.11 | 2.53 | 0.96 | 4.75 |
| q7 | 17.42 | 33.15 | 70.27 | 16.15 | 24.58 | 29.11 |
| q8 | 19.02 | 36.92 | 25.91 | 10.22 | 35.78 | 21.84 |
| q9 | 387.10 | 142.64 | 146.13 | 368.98 | 132.32 | 70.57 |
| q10 | 39.95 | 38.91 | 28.70 | 40.68 | 31.71 | 24.74 |
| q11 | 20.11 | 6.58 | 58.82 | 16.47 | 7.26 | 5.39 |
| q12 | 6.91 | 20.20 | 18.92 | 3.06 | 9.42 | 14.46 |
| q13 | 101.60 | 42.33 | 37.51 | 108.61 | 40.78 | 33.07 |
| q14 | 63.00 | 24.87 | 15.58 | 57.13 | 19.23 | 11.67 |
| q15 | 25.54 | 17.09 | 7.63 | 22.32 | 5.79 | 4.43 |
| q16 | 15.32 | 13.18 | 10.16 | 12.73 | 12.35 | 5.57 |
| q17 | 9.34 | 71.46 | 22.14 | 5.62 | 76.25 | 11.30 |
| q18 | 65.15 | 45.71 | 17.93 | 38.93 | 98.11 | 18.08 |
| q19 | 8.36 | 16.20 | 22.49 | 5.21 | 17.15 | 16.28 |
| q20 | 72.22 | 22.11 | 25.71 | 67.76 | 11.41 | 15.28 |
| q21 | 17.86 | 66.71 | 55.72 | 16.06 | 73.27 | 36.06 |
| q22 | 44.01 | 8.40 | 21.44 | 38.59 | 8.22 | 11.06 |