
Today, we introduced a new toolset for SingleStore that makes it easier to deploy, manage, troubleshoot, and monitor SingleStore. The new tools are easier to use, integrate more broadly, and contain new capabilities.
SingleStore already has management tools for these operations, so why create new ones? First, the existing toolset is a closed loop. The tools only work with SingleStore and it is not easy to integrate with them. We’ve had many customers request integration with the broader ecosystem of tools they already use for configuration, alerting, etc.
The new tools have been designed from the ground up to be easily integrated. In addition, the new toolset takes advantage of the role-based access control already built into the SingleStore engine. This gives you one place to manage which capabilities are available to each user.
Lastly, the new tools are completely separate from the SingleStore engine, which allows us to iterate on them faster. So you will see new releases of the tools on a faster cadence going forward.
The tools are broken down into two packages: command-line tools for managing SingleStore, provided in the toolbox package, and the monitoring UI provided in SingleStore Studio. All of the tools can be used together.
Management Tools
The three command-line tools for managing SingleStore are memsql-deploy, memsql-admin, and memsql-report:
- memsql-deploy is used to deploy the SingleStore software (the engine) to the various host machines that make up a SingleStore cluster. It can also uninstall and upgrade the software. memsql-deploy is also used for simple cluster installs, where it wraps a number of calls to the other tools.
- memsql-admin is used for creating and managing a cluster of nodes that have SingleStore running on them. You use it to create and delete nodes, assign each node a role, and stitch nodes into a cluster. You also use it for miscellaneous operations, such as setting a license for a cluster and setting configuration variables.
- memsql-report ensures that you have an optimal environment for running SingleStore. It runs checks to evaluate the health of the hardware, operating system, and cluster. The output of the checks come out as a simple Pass/Fail so you can easily spot potential trouble before it affects your running cluster. In fact, we recommend running memsql-report on your hosts before you install SingleStore, to ensure that your hardware and operating system are optimally configured.
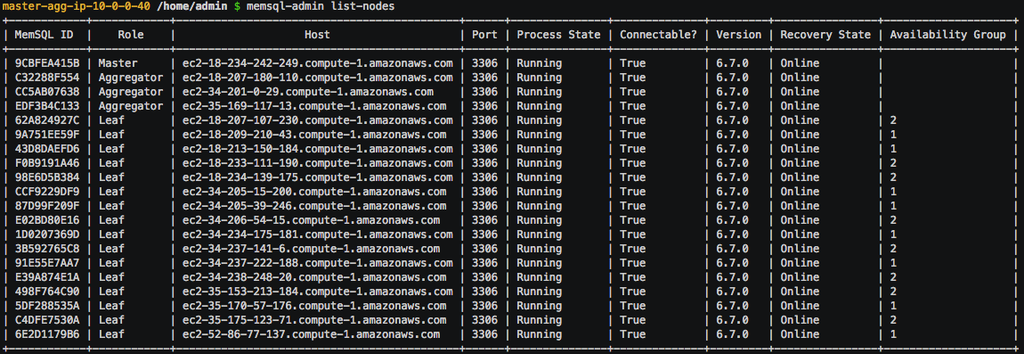
We have a recorded demonstration of each of the tools in use (no sound), which includes the screenshot shown above.
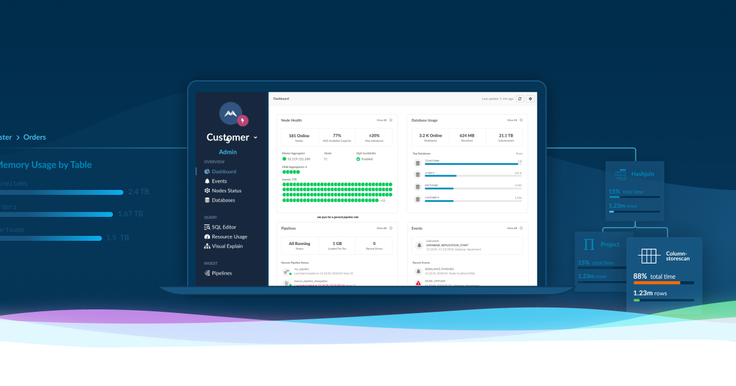
SingleStore Studio
SingleStore Studio provides a new UI for monitoring SingleStore and troubleshooting queries. It displays a top-level view so you can quickly get a handle on the health of a cluster, the databases, and the nodes. You can see details of how to use it in the SingleStore Studio documentation.
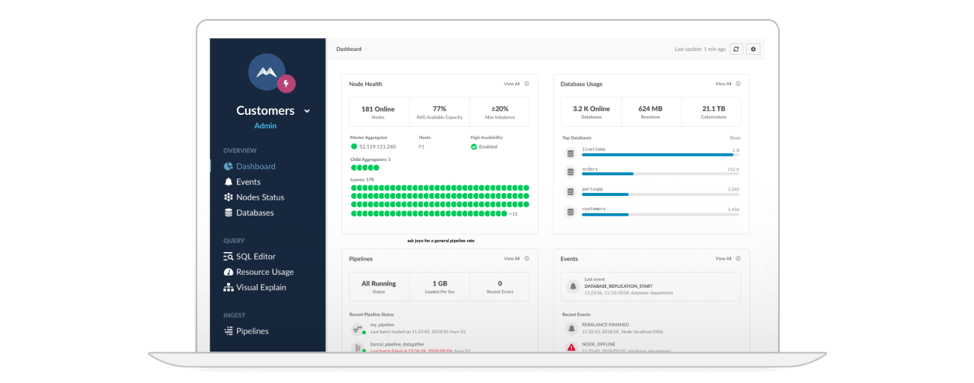
Studio also provides more detailed information on the events happening in the cluster and on specific features, such as pipelines. It provides a query editor for composing queries and a profiling mechanism to capture the state of the cluster over a period of time to allow you to examine what queries and what resources the cluster is spending the most time on.
Probably the most exciting feature of Studio is the new Visual Explain feature. SingleStore has had the Explain capability in the engine for several releases. The Explain feature details out the plan the engine will use to implement the query.
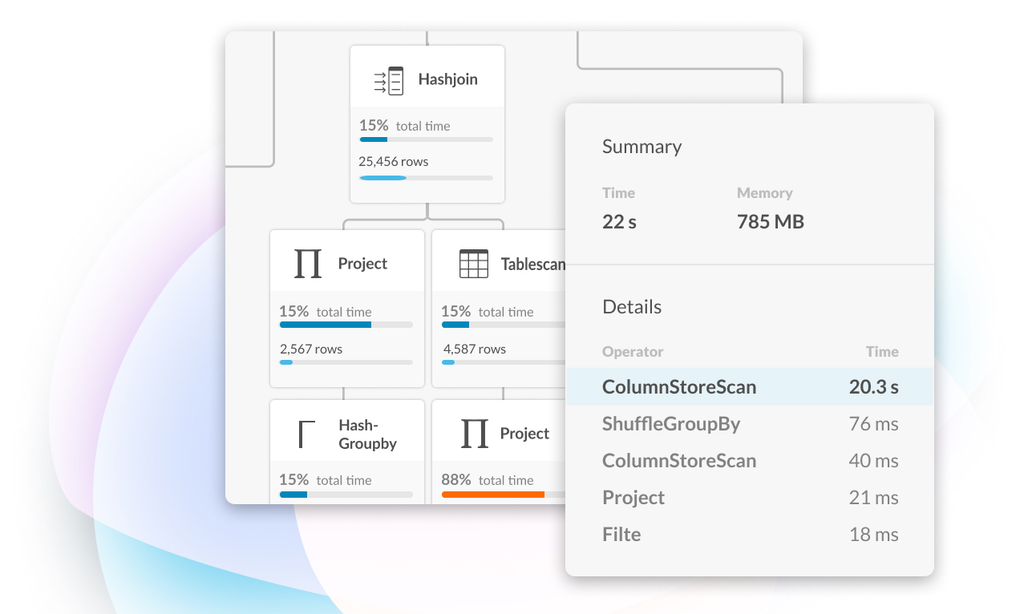
This information is invaluable for determining how to optimize the query for your data set. The explain plan is rendered as a JSON document, so it can be tough to understand without a lot of practice. Visual Explain is a way of visualizing the information in the explain plan in such a way that it makes it easy to drill down into the plan, identifying which places are the biggest bottleneck, and provide the greatest opportunity for optimization. Developers and DBAs alike will find this a delight.
Integration with Existing Tools
One of the most important aspects of the new tools is how well they will integrate with existing configuration and deployment tools. All the command-line tools were built with integration in mind, so they provide non-interactive modes and return well-structured information, all of which makes it easy to integrate them. We are shipping an AWS Cloudformation template as part of this release that integrates with the tools and allows you to spin up a cluster, with all the best practices encoded, in AWS in less than 4 minutes.
AWS Cloudformation is just the beginning. We will provide templates for all the popular configuration and deployment technologies (such as Puppet, Chef, etc…) in the near future. We also have documentation on how to integrate the SingleStore deployment tools in your own custom scripts as well.
The new SingleStore tools for deployment, management, troubleshooting, and monitoring are a significant upgrade in terms of ease of use and compatibility. Download and try them out today!
For more information on SingleStoreDB Self-Managed 6.7, see the press release and all eight blog posts on the new version: Product launch; managing and monitoring SingleStoreDB Self-Managed 6.7 (this post – includes SingleStore Studio); the new free tier; performance improvements; the Areeba case study; the Wag! case study; the creation of the Visual Explain feature; and how we developed adaptive compression.


.png?width=24&disable=upscale&auto=webp)


