At Spark Summit East in New York, we unveil PowerStream, an Internet of Things (IoT) simulation with visualizations and alerts based on real-time data from 2 million sensors across global wind farms.
Renewable energy, such as wind power, is a viable alternative to traditional sources. For example, Danish wind turbines set a new world record for generating energy in 2015. According to recently published data, wind power now accounts for 42.1% of the total electricity consumption in Denmark. As sensor technology advances, it becomes possible to monitor wind turbines on wind farms, ensuring maximization of air flow and mechanical power.

About PowerStream
PowerStream processes and analyzes simulated data from approximately 2 million sensors on 197,000 wind turbines installed around the world.
Sensors are found on individual wind turbines within wind farms, as illustrated in the diagram below:
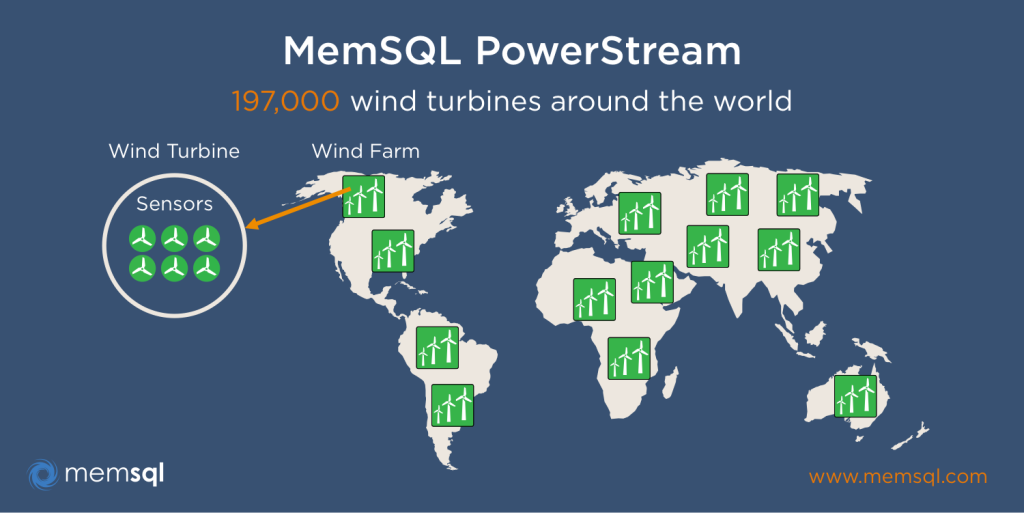
With temperature and vibration data points acquired from these sensors, plus a simple machine learning algorithm, PowerStream predicts and visualizes the health of turbines. The application predicts both behavior of individual turbines and calculates aggregate behavior of wind farms. It then displays green or red states. A red state predicts out of normal operating bounds, while a green state indicates the turbine or wind farm is within expected bounds.
PowerStream Architecture
PowerStream is powered by the SingleStore platform, which includes a database, Streamliner (an integrated Apache Spark solution), and Ops – the web interface for cluster deployment, management, and monitoring. Furthermore, PowerStream uses a set of simulated data producers written in Python, Apache Kafka (a real-time message queue), and a Javascript-based User Interface (UI). The architecture of PowerStream is shown below:
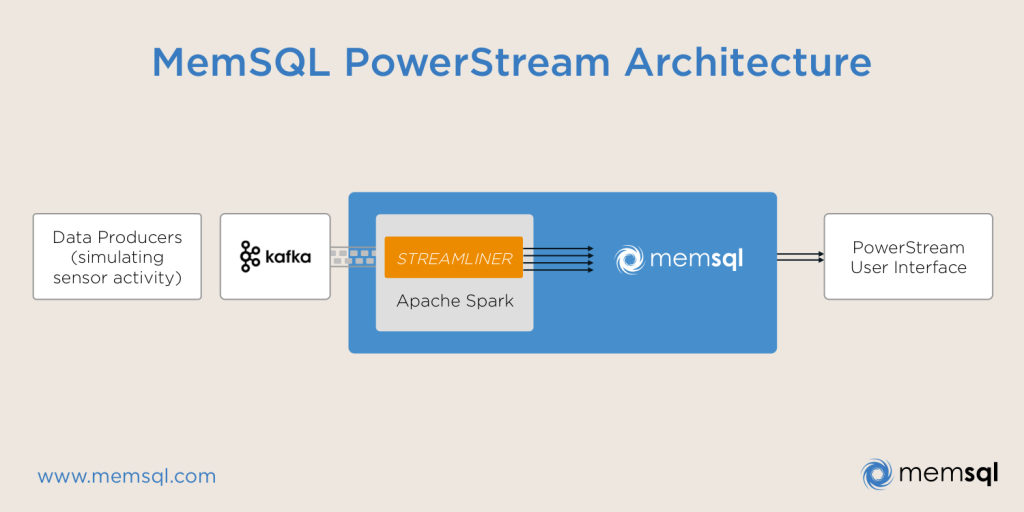
Data producers simulate sensor activity, pushing approximately 1 million data points every second from ten sensors on each turbine. Sensor data is sent to an Apache Kafka queue, which is processed by a SingleStore Streamliner data pipeline. The pipeline predicts the health of each turbine using a pre-trained machine learning model. The sensor, turbine, and wind farm states are stored in SingleStore and further analyzed to determine their health (green / red). Finally, the PowerStream UI queries the SingleStore database to display states in the web interface. These queries, and subsequent visual display, depend on the map geography and zoom level selected by the user.
Geospatial Functionality
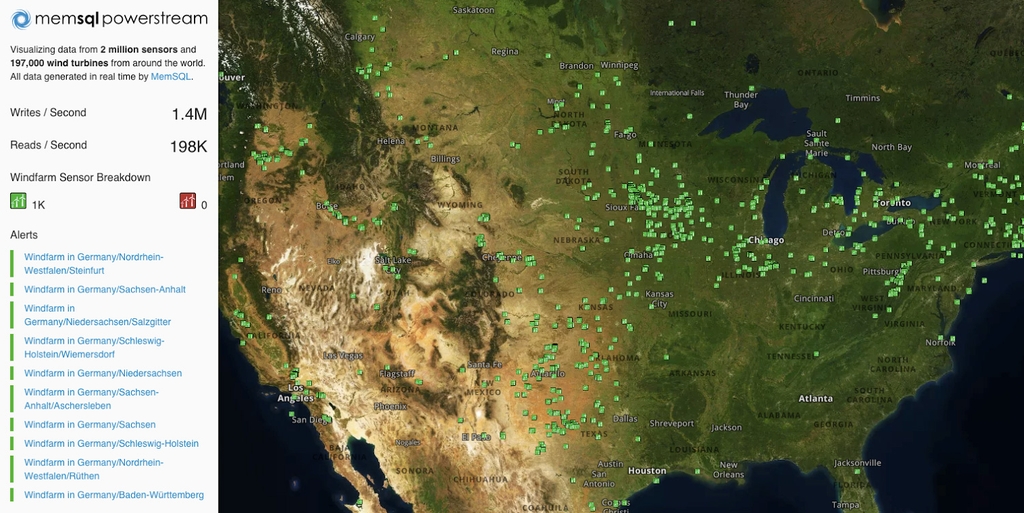
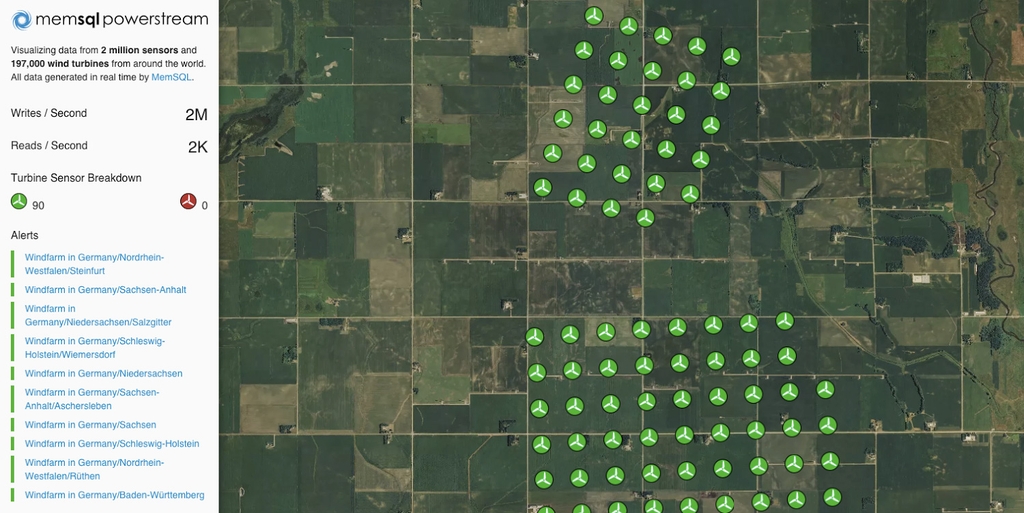
PowerStream also utilizes SingleStore Geospatial capabilities. Geolocation (longitude and latitude) of each turbine is stored in a SingleStore table, which is joined with other data when the user changes the map area in view. If the users zooms in closely, they will see status of specific turbines (depicted below), as opposed to wind farms (depicted above).
Large volumes of data are generated and manipulated in this showcase application – here are a few data points:
- SingleStore Streamliner processes approximately 1 million data points per second, then inserts it into a SingleStore database
- When a viewer moves the map on screen, several large database queries run and complete in real time. Specifically, large database JOIN operations between the sensors table (~2 million rows), turbines table (~200,000 rows) and wind farms table (~20,000 rows) occur in parallel. This produces a geospatial json file that is compressed and rendered instantly (between 50 and 500 ms) in the web-based UI.
- Real-time notifications push to the UI based on a
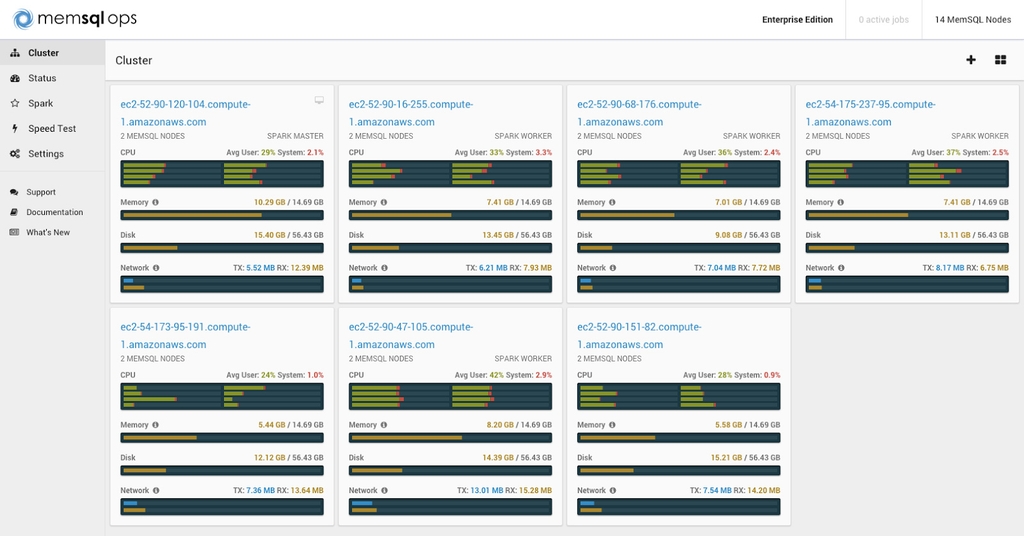
select *query from an events table, which scales up to 2 million records. Powerstream runs on 7 Amazon c4.2xlarge instances, at a rough cost of $0.311 hourly apiece, equating to just under $19,100 annually.
Take a look at the SingleStore Ops dashboard below, from which PowerStream application and database operators manage and monitor the platform:
Green Technology
PowerStream exemplifies one way to use modern technology for good. Applying IoT principles to energy challenges, like harnessing wind power, can inspire energy companies and government organizations to apply resources and contribute to a more efficient future. Real-time analytics applies globally, and will enable energy innovation to spread across countries and oceans.
See Powerstream live at Spark Summit East, Booth #101. Request a Demo here: singlestore.com


